Environmental Engineering Reference
In-Depth Information
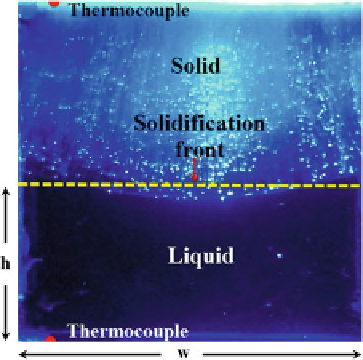
Fig. 2
Sample image of the
cell and the solidification
front. The positions of the
upper and lower
thermocouples are indicated
by
red dots
.The
horizontal
broken line
is the average
vertical position of the
solidification front. h is the
(time dependent) vertical
magnitude of the volume
occupied by the liquid and w
is the width of the cell
area is 12
6 pixels with an overlap of 50%. The flow is mostly two dimensional
and the color contrast between the solid and the liquid produced by the illumination
coming from the lower wall of the cell provides images of excellent quality as can
be seen in Fig.
2
.
×
3 Results
As heat is pumped from the fluid and from the lower boundary by the upper, colder
boundary, the temperature inside the cell drops and the thermodynamic conditions
inside the cell correspond to solidification. As will be described in more detail below,
the present design and operation of the cooling system leads to time-dependent upper
and lower temperature boundary conditions. Although this featuremakes it difficult to
generalize the results presented in this report, it is expected that the qualitative obser-
vations will be similar to those obtained by keeping constant temperature boundary
conditions. The total observation time is of the order of 40 min when the solidifica-
tion front touches the lower wall of the cell. The temperature of the thermocouples
inside the cell are shown in Fig.
3
. As it can be seen, the temperature of the upper
wall (
T
C
) is a monotonously decreasing function of time with an initial value of
0
ⓦ
C and a final reading of approximately
30
ⓦ
C. The temperature of the lower wall
(
T
H
) is 22.5
ⓦ
C at the onset of the observations and reduces to 10
ⓦ
C at the end of the
experiment. The temperature gradient between the upper and lower walls (
T
H
−
−
T
C
)
is initially 20
ⓦ
C but settles to 40
ⓦ
C after approximately 14 min from the beginning
of the experimental observations. Ambient temperature (
T
amb
)is22
ⓦ
C throughout
the experiment. The vertical broken lines in the figure indicate the earliest time where
the solidification front can be identified (
t
o
=
2
.
7 min) and the time when the motion
of the fluid stops (
t
s
=
15
.
7min).
Search WWH ::

Custom Search