Environmental Engineering Reference
In-Depth Information
To determinewhich aminoacid residues are the responsible for the open and closed
conformations discussed previously, we obtained the Ramachandran plot (Mathews
et al.
2002
), which maps out the conformations of the alpha carbon in a protein
(or visualize backbone dihedral angles
of aminoacid residues in protein
structure). In a Ramachandran plot we display the zone where the alpha carbon
conformations are stable through time and also the zones where there are alpha
helices and beta sheets. In Fig.
5
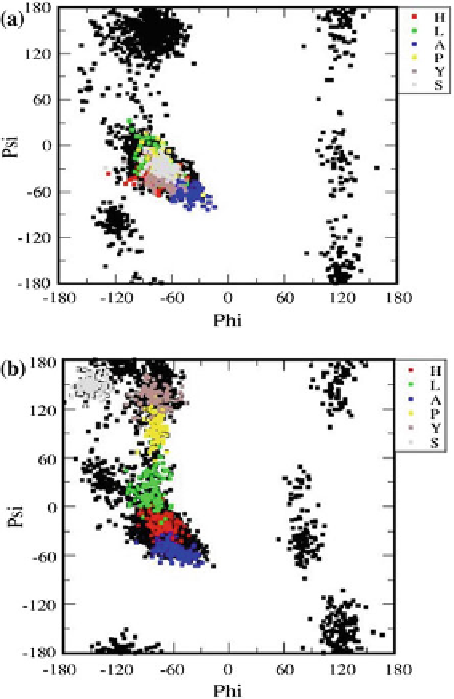
, we show two graphs where the top (a) represents
the open conformation (at 0.5M of NaCl), and the bottom (b) corresponds to a closed
structure, at 0.6M. Black dots represent the configurations (over all the simulation
time) of all the aminoacids in APOA1, while the different colors belong to specific
aminoacid residues (HLAPYS) throughout the entire simulation time. In Fig.
5
a, one
sees that theHLAPYS aminoacids are preferentially found in a relatively narrowzone
of angular values: this is the region of the alpha helix zone. By contrast, in Fig.
5
b
we see that the HLAPYS residues move to the beta sheet area (top left quadrant in
each graph), although this does not mean that they are forming beta sheets, instead it
ˈ
versus
˕
Fig. 5
Ramachandran plot
for
a
the open configuration
at 0.5M, and
b
for the closed
one at 0.6M of NaCl. The
axes represent the angles that
the
-C atom form with its
bonding neighbors. The
colors
and
symbols
on the
right borders represent the H,
L, A, P, Y and S residues of
the APOA1. The different
data points for a given
residue represent its time
evolution
ʱ
Search WWH ::

Custom Search