Environmental Engineering Reference
In-Depth Information
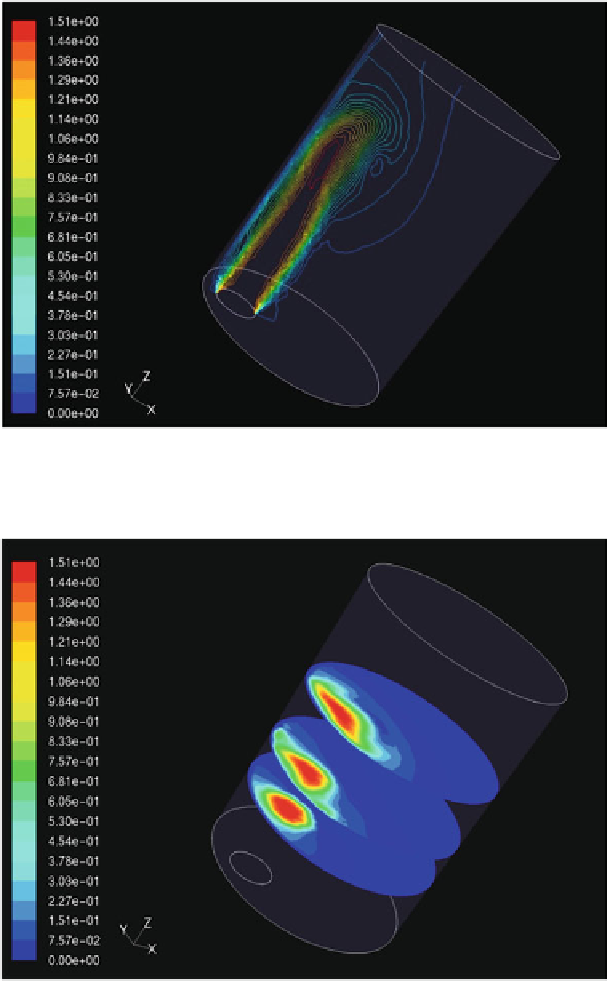
Fig. 3
Isocontour of the gas velocity in a section plane of the plume through its axis for the
same model of previous figures. The
colour-scale bar
and numbers on the left border indicate the
magnitude of the velocity in units of m s
−
1
Fig. 4
Contours of the gas velocity showing the cross-sectional structure of the plume at three
different heights for the same model of previous figures. The
colour-scale bar
and numbers on the
left border indicate the magnitude of the velocity in units of m s
−
1
Search WWH ::

Custom Search