Environmental Engineering Reference
In-Depth Information
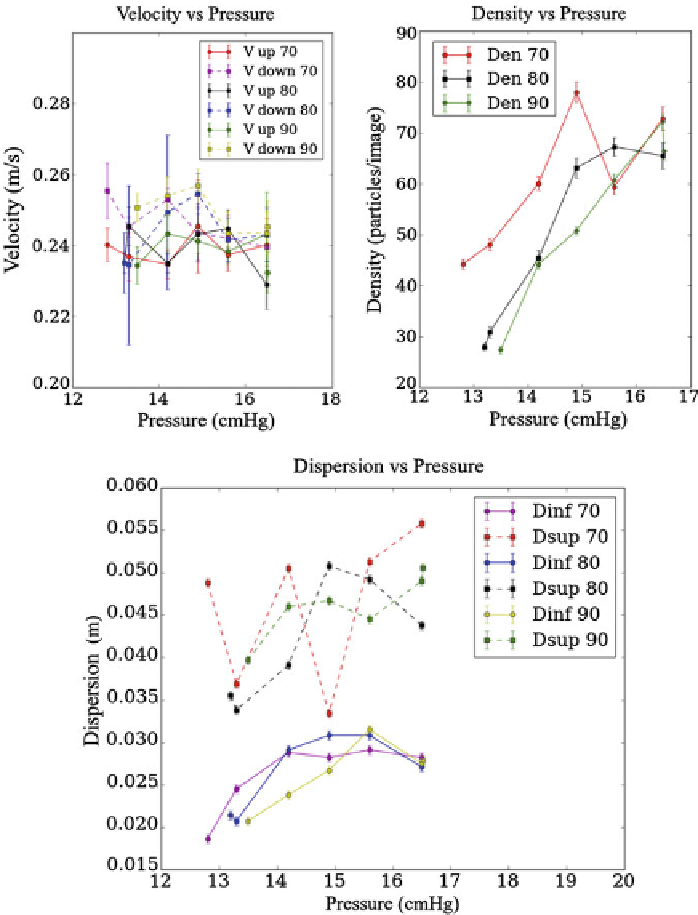
Fig. 7
Upper left
Average upward speed of bubbles versus pressure.
Upper right
Particle density
image versus pressure.
Bottom
Bubble dispersion at a height of 11 cm ('Dinf' on the graph) and a
height of 48 cm ('Dsup' on the graph) as a function pressure
Two reference points are taken into account to analyze the amplitude of oscillation
of the rising bubbles, the first at 11 cm and the second at 48 cm from the bubble gen-
erator. The bottom image of Fig.
7
shows that for pressures greater than 14.5 cmHg
Search WWH ::

Custom Search