Environmental Engineering Reference
In-Depth Information
5
5
10
4
8
4
ʱ
= 0.75
FO = 12.1
ʱ
= 0.748
FO = 1.39
ʱ
= 0.79
FO = 0.379
3
6
3
2
2
4
1
2
1
0
0
0
0.5
1
1.5
2
0.5
1
1.5
2
0.5
1
1.5
2
t
D
t
D
t
D
6
3.5
8
3
5
ʱ
= 0.751
FO = 0.378
ʱ
= 0.749
FO = 0.0756
ʱ
= 0.744
FO = 2.52
2.5
6
4
2
3
4
1.5
2
1
2
1
0.5
0
0
0
0.5
1
1.5
2
0.5
1
1.5
2
0.5
1
1.5
2
2.5
t
D
t
D
t
D
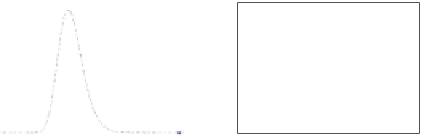
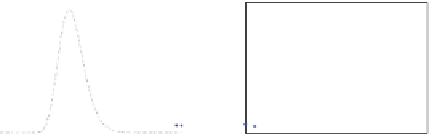
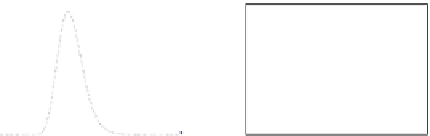
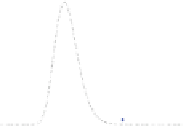
Fig. 4
Qualitative comparison between the synthetic data and the model predictions when only
α
is the fitting parameter. Description is the same as in Fig.
2
. The original parameters are
α
=
0
.
75,
D
ad
=
.
ʸ
=
.
0
0133 and
0
05
Ta b l e 4
Percentage of relative error in the estimated fractal parameters for different amount of
data and noise levels
40 Data
20 Data
10 Data
Parameter
5%
10%
5%
10%
5%
10%
α
0.80
0.27
0.53
3.87
0.13
4.80
D
ad
13.53
10.53
6.02
63.16
21.81
25.56
PRE
14.33
10.80
6.55
89.66
21.94
30.36
Here
α
and
D
ad
are the fitting parameters
6 Discussion of Results
The parameter estimation methodology developed for the fractal continuum model
works adequately. In the analysis the level of data noise, the amount of data points,
and other characteristics of the model such as the number of fitting parameters were
considered. The level of noise increases the level of uncertainty in the obtained
tracer transport parameter values. It holds in general that the higher the noise level,
the more complex the parameter estimation becomes. The percentage of relative
error (PRE) is a good estimator of the quality of fitting since the smallest values
matches the best estimation. This does not mean that all parameters have lower
values of PRE compared to others, but the total sum is smaller. Regarding the fitting
parameters, the level of noise affects the estimation of each parameter differently. The
estimation of
is slightly affected by the noise level because it is mainly associated
to the pulse position and its peak height. On the other hand,
D
ad
and
α
values
strongly depend on the noise level, since both are linked to tracer dispersion. As
can be observed in Figs.
2
,
3
and
4
, the noise level creates major uncertainty on
ʸ


Search WWH ::

Custom Search