Environmental Engineering Reference
In-Depth Information
10
5
5
8
4
ʱ
= 0.743
ʱ
= 0.775
ʱ
= 0.789
4
6
ʸ
= 0.0411
D
ad
= 0.0166
FO = 15.2
ʸ
= 0.023
D
ad
= 0.00899
FO = 1.57
ʸ
= 0.0176
D
ad
= 0.0125
FO = 0.314
3
3
4
2
2
2
1
1
0
0
0
0.5
1
1.5
2
0.5
1
1.5
2
0.5
1
1.5
2
t
D
t
D
t
D
6
3.5
8
5
3
ʱ
= 0.744
ʸ
= 0.0692
D
ad
= 0.014
FO = 2.46
ʱ
= 0.746
ʸ
ʱ
= 0.749
ʸ
2.5
4
6
= 0.048
D
ad
= 0.0146
FO = 0.489
= 0.0149
D
ad
= 0.0145
FO = 0.0643
2
3
4
1.5
2
1
2
1
0.5
0
0
0
0.5
1
1.5
2
2.5
0.5
1
1.5
2
0.5
1
1.5
2
t
D
t
D
t
D
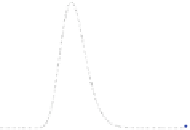
Fig. 2
Qualitative comparison between the synthetic data (
blue points
) and the model predictions
(
dashed black line
). From
left
to
right
, in each column, the amount of data varies from approximately
40, 20 to 10. The first and second rows correspond to 10 and 5% of noise, respectively. The
parameters are
α
=
0
.
75,
D
ad
=
0
.
0133 and
ʸ
=
0
.
05
5 Robustness of the Method
As mentioned before, the robustness analysis of the developed methodology consid-
ers a sensitivity analysis of the effect of the (a) noise level, (b) amount of data, and
(c) amount of parameters on the fitting. For this purpose the six synthetic data set
generated are used.
5.1 Sensitivity to the Level of Data Noise
The results regarding the fitting sensitivity to data noise level are presented in Fig.
2
.
In this figure the fitted breakthrough curve and the original data are displayed. The
top three plots correspond to 10% noise and the three bottom plots to 5% noise.
The two vertical plots at the left correspond to approximately 40 data points, the
two vertical plots at the center to near 20 data points and the two plots at the right
to around 10 data points. The effect of the noise level can not be inferred from the
qualitative comparison in Fig.
2
and a look to the quantitative results in Tables
1
and
2
is necessary. As shown in Table
1
the OF increases if the amount of noise increases
(keeping the same amount of data points). On the other hand, the percentage of
relative error (PRE) does not follow the same behaviour; an increment in noise level
does not necessarily imply an increment in its value. Conversely, as can be observed
fromTable
2
, for 40 and 10 data, an increment in the noise level means an unexpected
reduction of the PRE value. The PRE value for each parameter reveals how far they


Search WWH ::

Custom Search