Environmental Engineering Reference
In-Depth Information
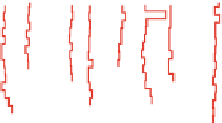
(a)
(b)
Fig. 3 a
Section of the EPR seamount showing the microstructure dissipation rates, and
b
amap
of the first 500m above the seafloor integrated dissipation rates
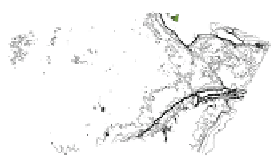
(a)
(b)
Fig. 4 a
The Drake passage on a exaggerated 3D view has a rather rough topography compared to
the west of Chile where DIMES US2 took place for most of the stations.
b
The tracer distribution
shows a rather different distribution on the early stations of the Drake passage
The spatial variation on the diffusivity values associated with the changes on
the ocean floor topography was also observed during the DIMES expedition US2.
As shown in Fig.
4
, the sampled area to the west of the Drake passage has a rela-
tively smooth bathymetry. The corresponding diffusivity values derived from “fine-
structure”, microstructure and tracer release experiment were typical background
values. Near the Drake passage, the abrupt change in bathymetry (Fig.
4
) is correlated


Search WWH ::

Custom Search