Environmental Engineering Reference
In-Depth Information
FWTE
HWTE
FWLE
FWtip
FWTE
HWLE
HWtip
HWTE
FWLE
HWLE
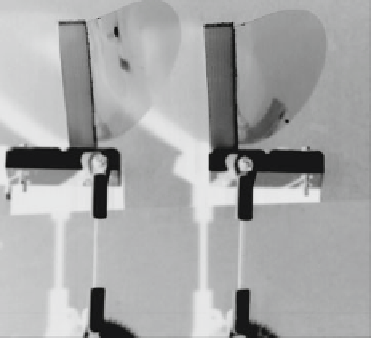
Fig. 6
Tracking the wing motion. Example of in-phase flapping at
f
=
23Hz.
Black circles
are
the points tracked on each wing for the leading and trailing edges (FWLE and FWTE, correspond
to the forewing, while HWLE and HWTE correspond to the hindwing). The
open circles
are the
positions of the win tips tracked
the right side wings and have a clearer view of the kinematics. The main feature
that can be seen in these time series of snapshots is the large deformation of the
wings during the flapping cycle. Indeed, the wings bend over a length scale that is
of the same order of magnitude than the chord length. In addition to the kinematics
of the compliant wings, which can be followed for each wing independently, Figs.
4
and
5
hint on the complex interaction that arises from the combination of the bend-
ing dynamics and the imposed forewing-hindwing phase lag. We will analyse this
interaction in the following by tracking the motion of different points on each wing.
Figure
6
presents the tracking in time of the
positions of the leading and
trailing edges of each wing at the point of maximum chord length (black circles,
FWLE and FWTE denoting forewing leading and trailing edge, respectively, while
HWLE and HWTE correspond to the equivalent points on the hindwing). Addi-
tionally, the tip of each wing is also tracked (empty circles). The latter is useful to
minimize the measurement error in the leading edge amplitude of motion since it
has a larger swept amplitude and the relative error is thus smaller. The time-series
of the positions of these points are shown in Fig.
7
a, b for two different values of
˕
(
x
,
y
)
for each
wing, which has been reported in Ramananarivo et al. (
2011
) to be a crucial element
of the propulsive performance of flexible flapping wings. The measured value of
. The main observation here is the trailing-edge-leading-edge phase lag
ʳ
ʳ
for several forewing-hindwing phase lags is shown in Fig.
7
c. A slight decrease is
observed for
, i.e., when the systems go from
in-phase flapping to a configuration with the hindwings leading by approximately a
third of a period, but the effect is very weak.
ʳ
when
˕
decreases from 2
ˀ
to 1
.
3
ˀ


Search WWH ::

Custom Search