Environmental Engineering Reference
In-Depth Information
16000
P1 EXP
P1 SPH
12000
8000
4000
0
0.0
1.0
2.0
3.0
4.0
5.0
6.0
Physical time (s)
16000
P2 EXP
P2 SPH
12000
8000
4000
0
0.0
1.0
2.0
3.0
4.0
5.0
6.0
Physical time (s)
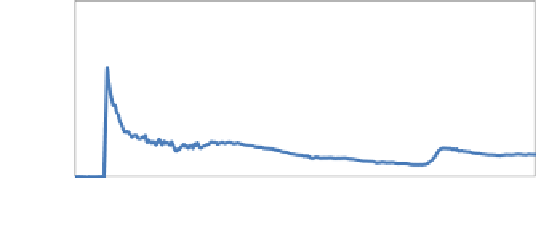
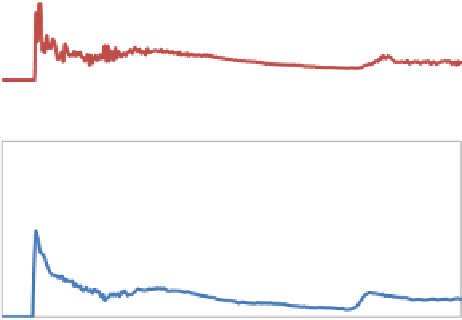
Fig. 4
Experimental and numerical pressures measured at the two gauges
Pressure was also measured experimentally. Different pressure sensors (Fig.
1
)
were used to collect the experimental pressure on the obstacle. The pressure on the
front side of the obstacle (P1 and P2) was computed by DualSPHysics to analyse the
validity of the model to predict the forces exerted by the fluid on the structure. Numer-
ical pressures were computed at the positions where the experimental sensors were
located. The comparison between experimental and numerical pressures is shown
in Fig.
4
. A close agreement between both signals can be observed. The maximum
experimental and numerical peaks, which correspond to the main water impact on
the obstacle, coincide in time. The presence of a secondary peak at approximately
5 s is also detected by the numerical simulation, although there is a slightly delay
with respect to the experimental one.
4 DualSPHysics Capabilities
In the following section some examples of the capabilities of the DualSPHysics code
are shown, where different functionalities implemented in the code are employed.
DualSPHysics is therefore proven to simulate wave propagation and wave-structure
interaction impact waves on a large and a complex structure.


Search WWH ::

Custom Search