Graphics Reference
In-Depth Information
The subjective sense from Figure 1 and Figure 2 indicates that the proposed
tracker outperforms the traditional kernel-based tracker and its amelioration in most
situations.
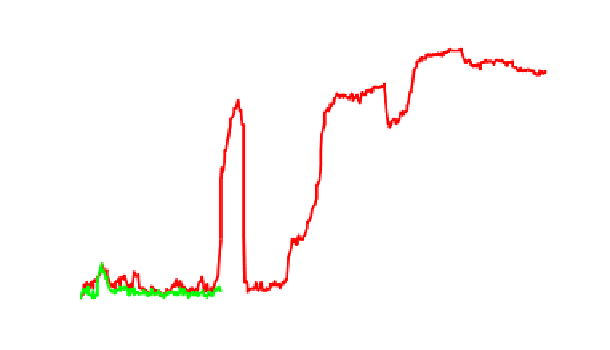
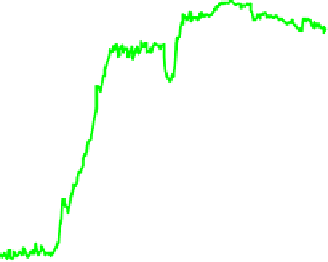
We quantitatively evaluate the performance using the center location error metric.
It measures the Euclidean distance between the center locations between the tracking
result and the ground truth. A smaller error indicates a better performance. Figure 3
shows the error plots of the trackers. Numerically, the mean errors of KBT, BC-KBT
and DKT are 138.9, 137.0 and 5.4 for the first sequence, and 62.5, 59.1 and 17.9 for
the second sequence. The results demonstrate that the proposed tracker exceeds the
referenced trackers.
We refer to Table 1 for more details of the mean values of the center location er-
rors comparison.
300
KBT
BC-KBT
DKT
250
200
150
100
50
0
0
50
100
150
200
250
300
350
400
450
Frames
300
KBT
BC-KBT
DKT
250
200
150
100
50
0
0
50
100
150
200
250
300
350
Frames
Fig. 3.
The center location error plots of KBT, BC-KBT and DKT for the sequence with
obvious background change (Top) and the sequence with complicated background clutters
(Bottom)


Search WWH ::

Custom Search