Graphics Reference
In-Depth Information
Figure2bconfirms our hypothesis that in the horizontal projection curve of fa-
cial X-ray image, the areas of nostrils, maxillary tooth and mandibular tooth are
corresponding to the three areas with high value of the horizontal projection. There is
a local minimum value between the maxillary tooth and mandibular tooth in the
curve. And we can find that this local minimum value is corresponding to a black
separation zone by analyzing the facial X-ray images.
As an effective time-frequency analysis method, wavelet transform can discover
both the low and high frequency information through signal decomposition so that we
can find something that we are interested in.
The projection will present a overall high-low trend as the horizontal projection of
the facial X-ray image has a high-low effect. Therefore, we can discover the high-low
distribution trend in the low frequency stage through the wavelet decomposition of
the horizontal projection data and then find the corresponding position so as to locate
our interested region—tooth area.
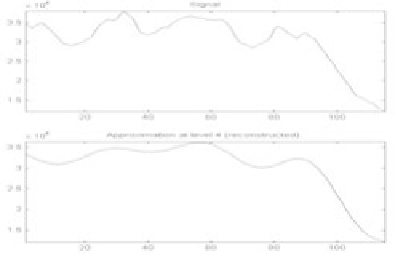
In the low frequency stage, the trend of the curve can be actually discovered
through the wavelet transform of the horizontal projection, as shown in Figure 3. In
this experiment, db10 wavelet [13] is adopted.
In the Level 4 approximation of the wavelet transform decomposition, the three
regions are respectively corresponding to the three local maximums. And the basic
regions of the maxillary tooth and mandibular can be affirmed by this way (which
are respectively corresponding to the second and third local maximums).
Fig. 3.
Facial X-ray Image Horizontal Projection and Its WT Approximation at Level 4
As shown in Figure 1 (a) (b), the dividing line between the maxillary and the man-
dibular tooth is the local minimum between their corresponding horizontal projec-
tion regions. Hence, after the maxillary and mandibular teeth regions are found
through the WT approximation at Level 4, their dividing line can be also found by
finding the position of local minimum. The experiment result is shown as the solid
black line in Figure 4 (a)
Search WWH ::

Custom Search