Graphics Reference
In-Depth Information
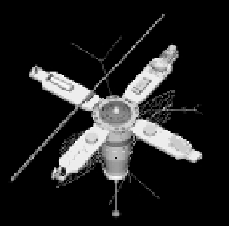
(a) Original image
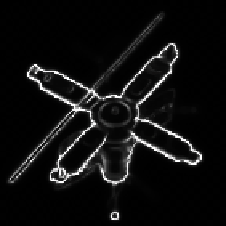
(b) SB
(c) AT
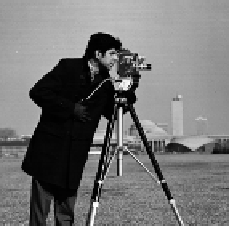
(d) Original image
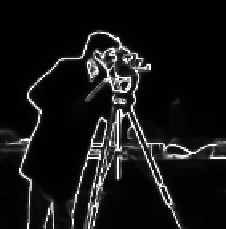
(e) SB
(f) AT
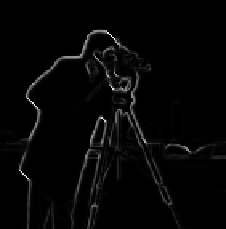
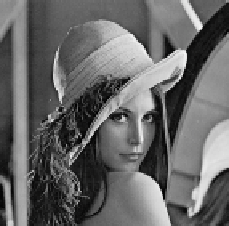
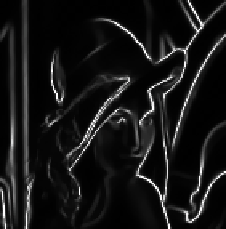
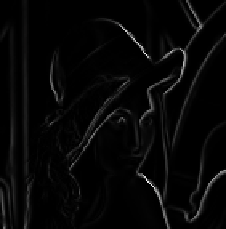
(g) Original image
(h) SB
(i) AT
Fig. 1.
Comparisons of clean images. Column 1: original images; Column 2: detected
edges by the SB algorithm; Column 3: detected edges by the AT algorithm.
by two different algorithms in Fig. 1. We observe from the above figures that
the SB algorithm outperforms the AT algorithm. And the SB algorithm is able
to detect all the meaningful edges.
In the second experiments, we turn to the comparison of two algorithms for
the noisy images in Fig. 2 (salt-pepper noise with
˃
=0
.
04). In this situation,
the
u
equation usually needs more than one inner iteration in order to smooth
the noisy image. We choose
ʻ
=1
10
3
and other parameters are the same as
×


Search WWH ::

Custom Search