Geology Reference
In-Depth Information
200
150
90% power
10% power
200
150
0.050
0.055
0.050
0.055
100
100
50
0
50
0
0
0.05
0.1
0.15
0.2
Frequency (1/n)
0.25
0.3
0.35
0.4
0.45
0.5
0
0.02
0.04
0.06
0.08
0.1
Frequency (1/n)
(c)
(d)
12
11.5
11
10.5
12
11.5
11
10.5
10
9.5
9
8.5
8
7. 5
10
9.5
9
8.5
8
7. 5
0
0.05
0.1
0.15
0.2
0.25
0.3
0.35
0.4
0.45
0.5
0
0.02
0.04
0.06
0.08
0.1
Frequency (1/n)
Frequency (1/n)
(e)
(f)
1. 8
1. 8
1. 6
1. 4
1. 2
1. 0
0.8
0.6
0.4
1. 6
1. 4
1. 2
1. 0
0.8
0.6
0.4
0.2
0
0.2
0
0
0.05
0.1
0.15
0.2
0.25
0.3
0.35
0.4
0.45
0.5
0
0.02
0.04
0.06
0.08
0.1
Frequency (1/n)
Frequency (1/n)
(g)
(h)
18
16
14
12
10
8
6
4
2
0
18
16
14
12
10
8
6
4
2
0
0
0.05
0.1
0.15
0.2
0.25
0.3
0.35
0.4
0.45
0.5
0
0.02
0.04
0.06
0.08
0.1
Frequency (1/n)
Frequency (1/n)
(i)
(j)
1
0.999
1
0.999
0.055
0.050
0.998
0.997
0.996
0.995
0.998
0.997
0.996
0.995
“False positives”
0.994
0.993
0.994
0.992
0.991
0.99
0.993
0.992
0.991
0.99
0
0.05
0.1
0.15
0.2
0.25
0.3
0.35
0.4
0.45
0.5
0
0.02
0.04
0.06
0.08
0.1
Frequency (1/n)
Frequency (1/n)
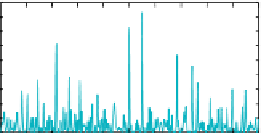
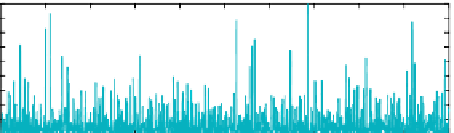
Figure 4.23
Harmonic F-testing of the signal+red noise test series with seven 4π multitapers using
pmtm,m, mtmdofs.m
,
and
ftestmtm.m
(see Appendix). Vertical dashed lines indicate the positions of the two signal frequencies at 0.050 and
0.055 (red arrows). The shaded area of the frequency space indicates the region with 10% of the total power. (a) Power
spectrum over [0,f
Nyq
]; (b) power spectrum over [0,0.1]; (c) dof for the F-test denominator over [0,f
Nyq
]; (d) dof for the F-test
denominator over [0,0.1]; (e) amplitude spectrum over [0,f
Nyq
]; (f ) amplitude spectrum over [0,0.1]; (g) F-value (signal-to-
noise ratio) over [0,f
Nyq
]; (h) F-value (signal-to-noise ratio) over [0,0.1]; (i) significance level of F-values over [0,f
Nyq
]; (j)
significance level of F-values over [0,0.1]. Significance levels were computed by integrating the F-distribution of 2 and ν(f )-2
degrees of freedom from zero to the estimated F-value at frequency (f ). The high frequency region with only 10% of the total
power is prone to “false positives” (i.e., as μ
res
(f ) → 0, F-value → ∞.) Horizontal dashed lines in (i) and (j) indicate the
significance levels of the two signal frequencies, which have the first and third highest levels over [0,f
Nyq
] and are first and
second over [0,0.1]. The second highest F-test at f = 0.34 (black arrow) is associated with the highest F-value, but ν(f ) - 2 = 9.9
reduces its significance to overall second place. This analysis was computed with zero padding to 4N.