Geology Reference
In-Depth Information
3.5
6
Declines to
3 to 4 dofs
toward f
Nyq
3
134 kyr
5.8
30.7 m
2.5
232 kyr
53.3 m
5.6
2
Robust (0.147)
Classical
GPTS calibration
230 m/Myr
99%
95%
90%
AR(1)
99%
95%
90%
AR(1)
1. 5
357 kyr
5.4
82 m
64 kyr
1
ρ
est
= 0.6630
ρ
est
= 0.8035
14.6 m
dof's
5.2
24 kyr
23 kyr
21 kyr
0.5
5.6 m
5.3 m
4.7 m
5
0
0
0.05
0.1 0.15
Frequency (cycles/m)
0.2
0.25
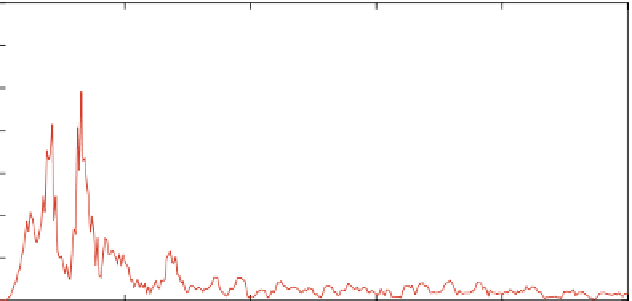
Figure 4.21
2ð multitaper spectral estimation of the Arguis ARM stratigraphic series depicted in Figure 4.2, here
linearly interpolated to a constant Δd = 0.6757 m, with a 10% weighted (lowess) average removed (80 m averaging
window, see Figure 4.4). The average sample rate for the original series is 0.6757 ± 0.58 m, which converts to an
average f
Nyq
= 1/(2 × 0.6757 m) = 0.74 cycles/m. The spectrum is adaptive weighted; the effective dof are computed
from the same adaptive weights, and are stable, fluctuating slightly around 5.8. For convenience, the CLs of both
models were estimated using 6 dof (the small fluctuations in dof produce very small changes in the CLs). The
classical red noise model was computed using Husson's
redconf.m
; the robust red noise model was computed using
the SSA-MTM Toolkit with a 0.147 cycle/m median filter with linear fitting.
ARM series, that has been resampled to a uniform 0.6757 m spacing, i.e., the
average spacing for the entire series, necessary for accurate calculation of the
lag - 1 autocorrelation coefficient. The effective dof over f = [0,0.1 cycles/m]
averages about 5.8; for convenience 6 dof were assumed for the CLs of both
models. The two noise (null) models estimated from the Arguis ARM series
are quite different from one another compared with the test series case in
Figure 4.20. Spectral power is concentrated in the very low frequencies,
which greatly influences the classical red noise model which estimates
ρ = 0.8035. The robust model rejects spectral peak outliers as noise, i.e., the
high power peaks in the low frequencies; this results in a substantially “less
red” null model, with an estimated ρ = 0.6630. The labeled spectral peaks all
exceed at least the 95% CL for either model, and based on chronological con-
straints from the GPTS (Figure 4.2) may be evidence for Milankovitch cycles.
The dramatic difference between classical and robust estimates of the noise
indicates that the latter has detected large spectral outliers in the low
frequencies, i.e., the 30-80 m variations; this suggests that true ρ of the noise
is closer to the robust estimated ρ = 0.6630. Sensitivity studies of the robust
model that varies the median filter length, as demonstrated in Figure 4.20,
may provide additional clues about true ρ.
The selection of the CL that is most appropriate for interpretation is an
open issue. Statisticians and scientists who work with highly controlled
signals adopt very strict CLs in excess of 99%. However, in cyclostratigra-
phy, variable accumulation rates result in poorly controlled signals and
cause true lines and spectra to be recorded at different wavelengths, which