Geology Reference
In-Depth Information
(a)
10
Signal
0
Signal+white noise
-10
10
0
-10
10
Signal+red noise
0
-10
0
500
1000
n
1500
2000
(b)
(c)
10
4
10
2
10
0
10
-2
10
-4
16
14
12
10
8
6
Signal+white noise
Signal+white noise
Signal+red noise
Signal
4
2
0
Signal
Signal+red noise
10
-6
0
0.1
0.2
0.3
0.4
0.5
0
0.1
0.2 0.3
Frequency (1/n)
0.4
0.5
Frequency (1/n)
(d)
(e)
10
4
10
2
10
0
10
-2
10
-4
Signal+red noise
14
Signal+red noise
13.5
Signal+white noise
Signal
Signal+white noise
Signal
10
-6
13
0
0.02 .04 .06 .08 .1
Frequency (1/n)
0
0.02 .04 .06 .08 .1
Frequency (1/n)
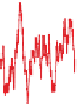
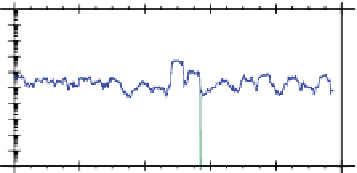
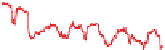
Figure 4.17
Effective degrees of freedom ν(f ) estimated for three time series using seven 4π multitapers. (a) Top:
noiseless signal of length N = 2048 represented by the test time series of Figure 4.10a (variance = 1); middle: same
signal plus white Gaussian noise (variance = 25), computed using
randn.m
(5× randn(2048,1)); bottom: same
signal plus strong AR(1) red noise (variance = 25), computed by submitting the same Gaussian white noise used
just previously into
markovseries.m
and setting ρ = 0.9 (details in Section 4.3.6) and rescaling the variance to 25.
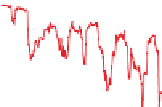
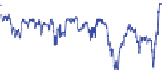
(b) Adaptive weighted 4π multitaper spectra of the three time series shown in (a). (c) Degrees of freedom ν(f )
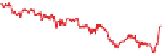
estimated from the adaptive weights of the three spectra in (b). (d) Detail of (b) centered on the two signal
frequencies at f=0.050 and f=0.055. (e) Detail of (c) centered on the two signal frequencies at f = 0.050 and
f = 0.055. The horizontal dashed line in (c) and (e) represents the dof that are assigned (14 in this case) when
adaptive weighting is not applied.