Geology Reference
In-Depth Information
(a)
3
1. 0
2
0.8
1
0.6
0
0.4
-1
0.2
-2
-3
0
0
0.01
0.02
0.03
0.04
0.05
Cycles/kyr
0.06
0.07
0.08
0.09
0.1
(b)
3
1. 0
2
0.8
1
0.6
0
-1
0.4
-2
0.2
-3
0
0
0.01
0.02
0.03
0.04
0.05
0.06
0.07
0.08
0.09
0.1
Cycles/kyr
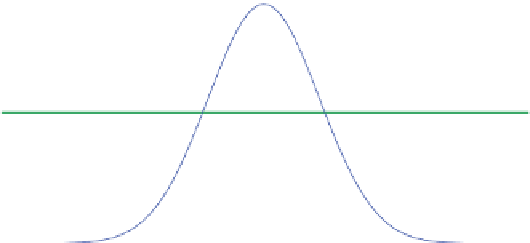
Figure 4.6
Magnitude (blue curves) and phase (green curves) responses (“Bode plots”) of two frequency domain
band-pass filters
with equivalent passbands defined with cut-off frequencies at f
low
= 0.035 cycles/kyr and f
high
= 0.065
cycles/kyr (red dashed lines) to recover the precession index from a 65° North summer insolation series sampled at
Δt = 1 kyr, i.e., defining a frequency range of 0 to 0.5 cycles/kyr. (a) Gauss band-pass filter and (b) Taner band-pass filter.
These responses were estimated by passing an impulse function (a series with a 1 followed by a string of 0s for a total
length of 4096 points) through
gaussfilter.m
and
tanerfilter.m
(Appendix) and then by Fourier transforming the output
and computing the squared modulus and phase.
4.3.5.1 The Fourier Transform
The Fourier transform maps the variability of a time series into a set of sines
and cosines of different frequencies, each weighted with a “Fourier coeffi-
cient.” It estimates the frequencies and amplitudes of sinusoids that can
be used to reconstruct the time series, thus deconstructing the time series
into its “component” periodicities. The phase is determined by the relative
contributions of sine and cosine at a given frequency. The
fast Fourier
transform (FFT)
, developed for digital computers (Cooley & Tukey 1965)
restricts the number of frequencies that are calculated to N/2 for a discrete
time series of length N and sampled at Δt intervals. The lowest measurable
frequency (longest period) is 1/NΔt, i.e., which has a period that is the