Geology Reference
In-Depth Information
4
Egenoff et al. marker beds
Rank
118
3.5
3
2.5
2
1. 5
1
0.5
Rank
M layer
N layer
O layer
P layer
80
60
40
1
500
0
0
0
0.01
0.02 0.03
Cycles/cm
0.04
0.05
12
500
MS
8
4
0
-4
MS
800
400
300
200
100
0
120
58
0
0.01
0.02
Cycles/cm
0.03
0.04
0.05
12
9
6
3
ARM
1600
ARM
500
1200
800
400
0
110
85
66
0
5
4
3
2
1
0
0
0.01
0.02
0.03
0.04
0.05
Cycles/cm
2.5
2
1. 5
1
0.5
0
SIRM
400
SIRM
110
58
0
0.01
0.02
0.03
0.04
0.05
Cycles/cm
0.15
16
12
8
4
0
800
375
ARM/SIRM
ARM/SIRM
0.1
0.05
110
58
0
0
0.01
0.02
0.03
0.04
0.05
S-ratio
Cycles/cm
1
0.2
0.15
0.1
0.05
0
0
S-ratio
800
0.9
375
200
110
70
0.8
0.7
0.01
0.02
0.03
0.04
0.05
0
500
1000
1500
Stratigraphic position (cm)
2000
2500
3000
3500
4000
Cycles/cm
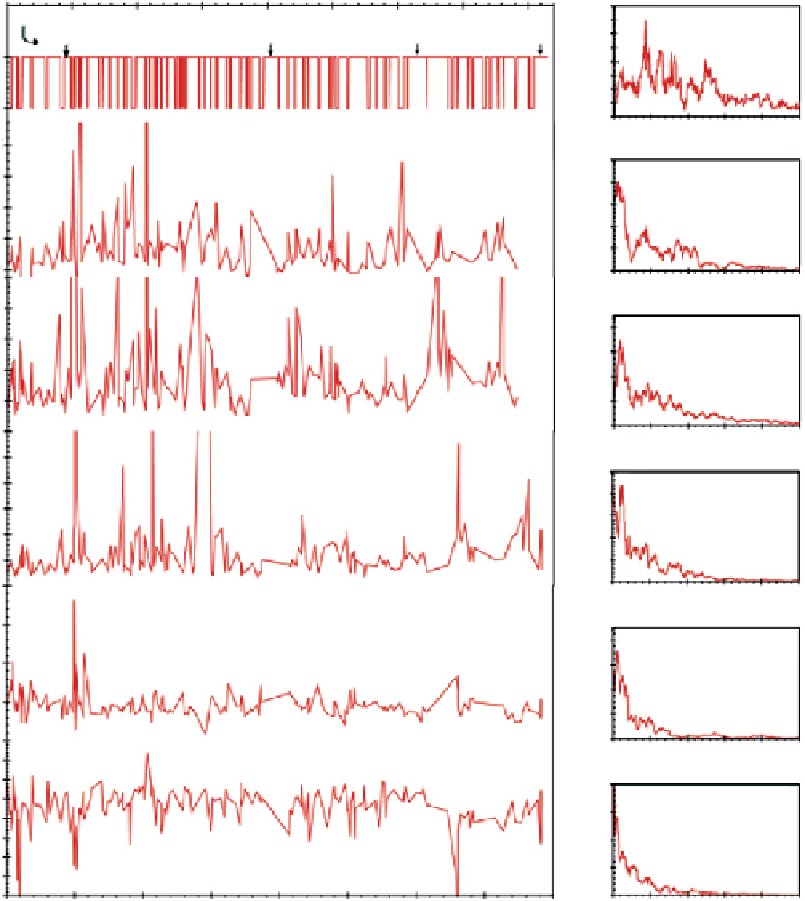
Figure 6.8
Rock magnetic cyclostratigraphy from the Forcellone section of the Latemar. Spectral analysis of depth rank
(a) and magnetic parameters (b) show spectral peaks at about 100 and 500 cm. Source: Spahn, Kodama & Preto 2013.
Reproduced with permission of John Wiley & Sons, Inc.
The case for assigning the meter scale cycles to precession in the Triassic
is based primarily on the 5:1 bundling of the shallowing upward sequences.
An independent age control using magnetostratigraphy was attempted by
Kent et al. (2004), but the paleomagnetic data suffered from secondary over-
printing, most likely caused by lightning strikes. The exposed high elevation
outcrops of the Latemar would be a very likely spot for lightning strikes and