Geoscience Reference
In-Depth Information
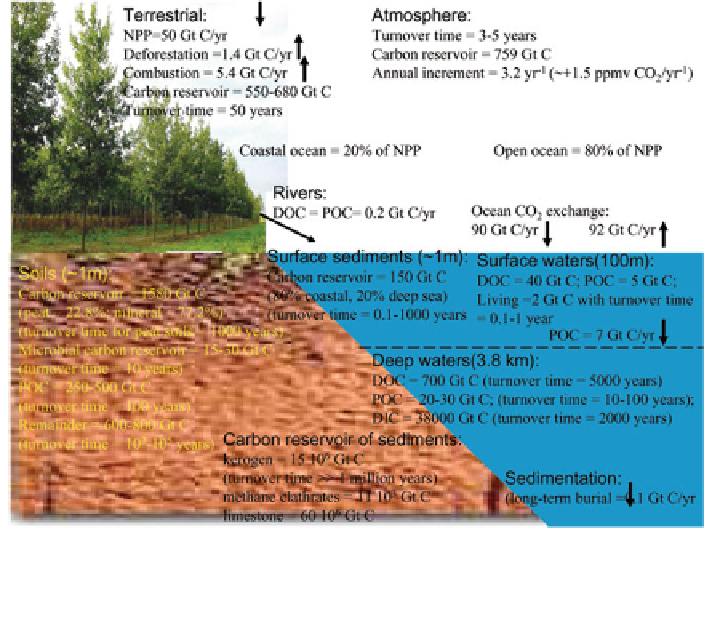
Fig. 1.24 Global carbon reservoirs, fluxes, and turnover times. Pool sizes and fluxes are given in
Gt (10
15
g) C and Gt C year
−
1
, respectively. Turnover times (reservoir divided by largest flux to or
from reservoir) are in parentheses. To convert Gt C to moles C, multiply by 8.3
×
10
10
(
http://
the oceans in the form of two or three layers covering the photic layer and deep
layers. Within the photic layer, the layers can be selected above and beneath the
thermocline. The spatial non-uniformity of the ocean is demonstrated through
upwelling and latitudinal zones, with different rates and directions of the oceans-
atmosphere CO
2
exchange. More detailed schemes of the global carbon cycle take
into account non-uniformities in the carbonate system of the oceans, which makes it
possible to considerably increase the accuracy of the respective models. Two of the
widely used schemes of this type are shown in Figs.
1.26
and
1.27
.
The role of the World Ocean in the global CO
2
cycle is mainly manifested
through the process of its exchange on the atmosphere-ocean border. The intensity
of gas exchange between the ocean and the atmosphere is determined by the
dynamic characteristics of the turbulent layers of water and air near the interface.
Here, numerous physical schemes appear that re
ect the situations of sea wave
formation, as well as formation of foam and various
fl
films. As a result, carbon
dioxide either dissolves in the ocean providing thereby the in
ow of CO
2
needed
for photosynthesis or is emitted from the ocean into the atmosphere. The cause of
this binary situation on the air-water border is the difference between the partial
pressures of CO
2
in the atmosphere and CO
2
dissolved in the water. Actually, this
fl
Search WWH ::

Custom Search