Geoscience Reference
In-Depth Information
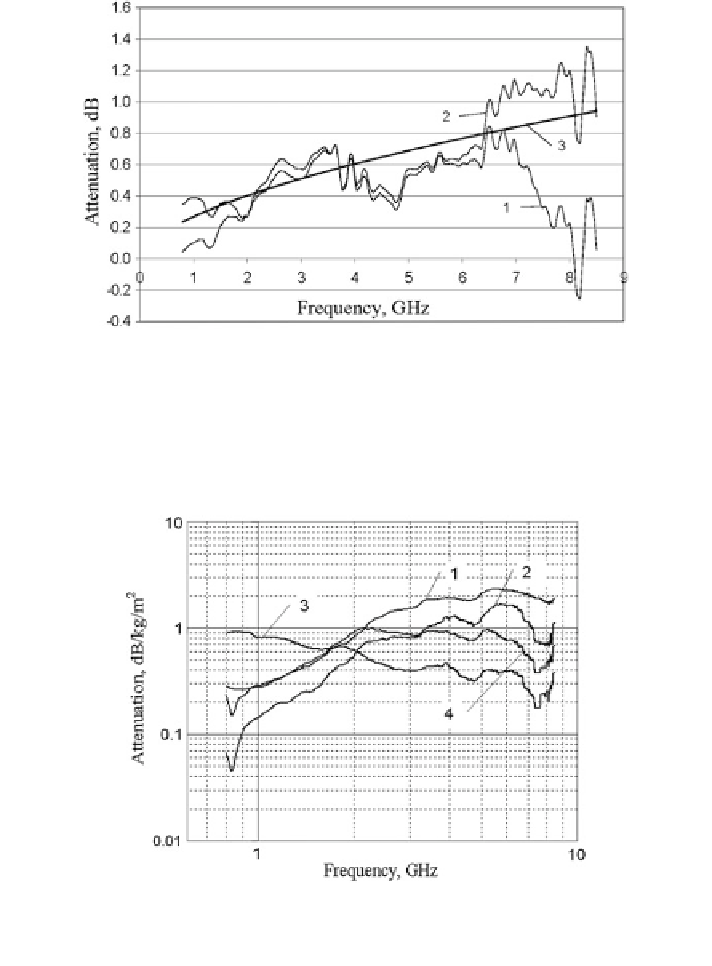
Fig. 8.25 Frequency dependence of the power attenuation in the pine branches under humidity
equaled 17.1 %. Notation 1 values of attenuation measured without correction; 2 corrected values
of attenuation; and 3 approximation of curve 2 by power function. Correction of measured values
of attenuation was realized by means of neutralization of the power percolation effect from
waveguide (Chukhlantsev 2006)
Fig. 8.26 Frequency dependence of electromagnetic wave attenuation in the aspen branches.
Notation 1 branches of 5 mm diameter with leaves; 2 branches of 5 mm diameter or less without
leaves; 3 thick branches of 20
50 mm diameter; and 4 rough branches of 5
20 mm diameter
-
-
for different locations of the receiver off the tree. As a result, the database of the
EMW attenuation was synthesized (Golovachev et al. 2004; Vinogradova et al.
2004).
In addition, the available microwave radiometric and SAR data are being pro-
cessed and studied.
Search WWH ::

Custom Search