Geoscience Reference
In-Depth Information
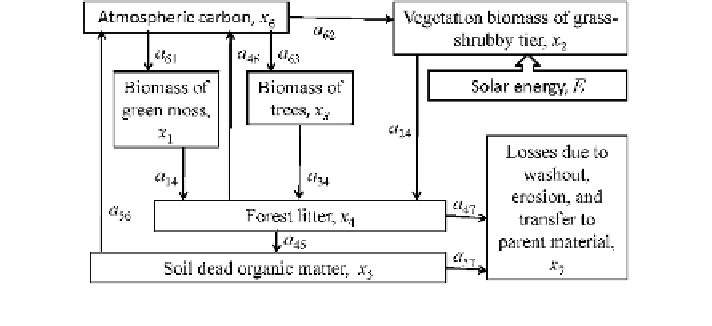
Fig. 8.16 Carbon cycle in the forest ecosystem
decomposition are described by linear or exponential models. Velocities of the
biomass dying are modeled by linear models. In general, the choice of model forms
to parameterize the carbon cycle depends on the existing database about forest
ecosystem parameters and characteristics. Below,
the speci
c models are
considered.
Photosynthesis is described by the equations:
A
6i
¼
b
i
u
i
ðÞW
i
ðÞ
f
i
x
ð
h
i
ðÞ;
ð
i ¼ 1
;
2
Þ
A
63
¼
b
3
u
3
ð
T
ÞW
3
ð
E
Þ
f
3
ð
x
5
Þ
h
3
ð
w
Þnð
x
3
Þ;
where
ʲ
i
(i=1, 2, 3) are the coef
cients that re
fl
ect a dependence of photosynthesis
on the vegetation type; and
φ
i
φi(T) is the dependence of photosynthesis on the
temperature T under the forest canopy. Functions
ʨ
i
,f
i
and h
i
reflect the photo-
synthesis dependence on illumination, mineral salts and moisture. Function
ʾ
characterizes a dependence of photosynthesis on the biomass of trees. The other
functions have the following view:
i ¼ 1
;
2
; W
i
ðÞ
¼exp
ða
i
E
Þ
u
i
ðÞ
¼1
þðd
i
=
100
Þ
T
T
opt
ð
Þ; u
3
ðÞ
¼1
þðd
3
=
100
Þ
T
T
A
;
opt
ð
i ¼ 1
;
2
;
3
Þ;
=r
i
g
Þ
c
;
f
i
x
ðÞ
¼exp
a
i
=
x
5
ð
Þ
ð
i ¼ 2
;
3
Þ;
f
1
x
ðÞ
¼1
;
h
i
ðÞ
¼exp
f
b
i
½w
w
A
;
opt
w
opt
ð
i ¼ 1
;
2
;
3
Þ; n
x
ðÞ
¼x
3
=
x
3A
ð
where
are constants; T
opt
and T
A,opt
are optimal
temperatures under the forest canopy and in the free atmosphere for photosynthesis,
respectively; w
opt
and w
A,opt
are optimal humidity under the forest canopy and in
free atmosphere for photosynthesis, respectively.
Carbon
ʴ
i
, a
i
,
ʱ
i
,b
i
,
˃
i
(i=1, 2, 3) and
ʳ
fluxes from vegetation tiers of the forest ecosystem are described by the
following models:
fl
a
i4
¼ k
i
x
i
ð
i ¼ 1
;
2
Þ;
a
34
¼ k
3
x
3
=
½1
þ
d
ð
T
T
A
Þ;
where k
i
(i=1, 2, 3) are the proportionality coef
cients.
Search WWH ::

Custom Search