Geoscience Reference
In-Depth Information
(1) the region of background characteristics when the ocean-atmosphere system
parameter variations during a restricted time interval is changed in the limits of
statistical stability;
(2) the region of the uncertainty, where the probability of the beginning of a
hurricane exceeds the level 0.5; and
(3) the region of the existence of the hurricane where the velocity of changes of all
parameters {x
i
} achieve maximal values.
The control of the I
m
(t) dynamics in the case of Fig.
7.14
with the sequential
analysis shows that in the zone
1
N
2
E(
ʽ
) = 17, D(
ʽ
)
0andW
c
(x)
0. At this
→
→
3
2
E(
time, in the zone
N
ʽ
) = 9, D(
ʽ
)
→
5, x =
ʽ
/D(
ʽ
)
→
1.35, c
→
16 and
W
16
(1.35)
0.912. The latter explains the result represented in Fig.
7.18
. In other
words, processing from verbal reasoning to a quantitative estimation of the
I
m
(t) dynamics, we introduce a generalized calibrated scale
→
ʞ
, for which we pos-
tulate the presence of relationships of the type
ʞ
1
<
ʞ
2
,
ʞ
1
>
ʞ
2
or
ʞ
1
=
ʞ
2
. It means
that there always exists a value of I
m
(t)=
which determines when the ocean-
atmosphere system phase transition of a given type can be expected. As a result, the
magnitude
ˁ
h ¼
I
m
ðÞq
j
j
determines the expected time interval before the phase
transition occurs.
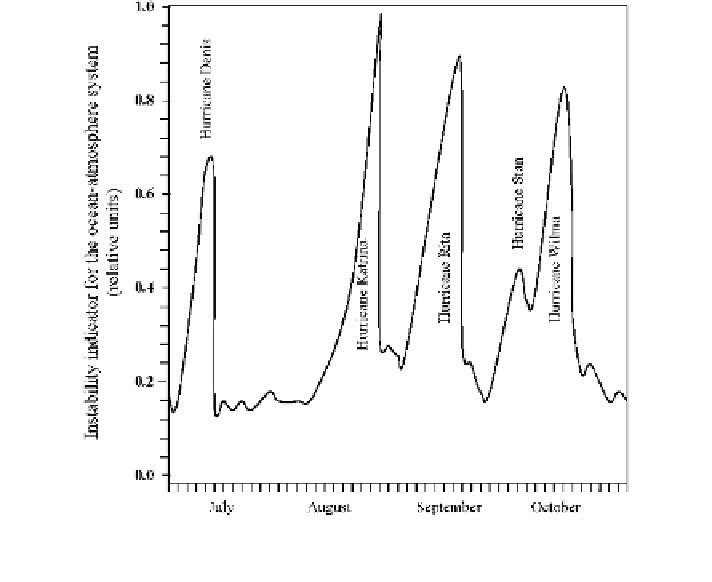
Fig. 7.18 Dynamics of the ocean-atmosphere system instability indicator calculated for the 2005
tropical hurricane season based on data from meteorological station No. SMKF1 (24
°
37
′
36
″
N,
81
°
06
′
36
″
W). Parameters of I
m
(k) are s = 17, m =24h,N =7,K = 123 days
Search WWH ::

Custom Search