Geoscience Reference
In-Depth Information
Fig. 7.11 Configuration of the global tropical buoy meteorological stations. Color marking of the
station types:
ux and CO
2
enhanced, -planned. (
https://climatedataguide.ucar.edu/climate-data/tropical-moored-buoy-
-
fl
-flux reference site,
-standard mooring,
-CO
2
enhanced,
-
fl
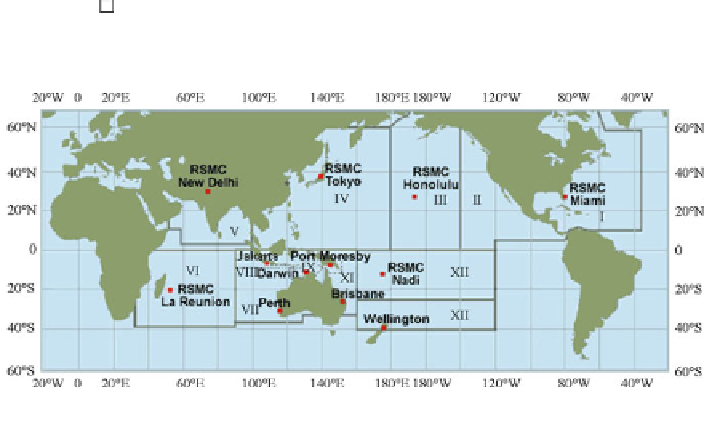
Fig. 7.12 World centers for the observations of tropical cyclones (Table
7.7
)
Oceans. The most densely spaced meteorological stations are in the tropical sector of
the Atlantic Ocean near the U.S. State of Florida. An assessment of the algorithm that
is proposed in this paper is accomplished by means of a choice of such meteoro-
logical stations that are located close to the equator, where severe hurricanes are
registered by the existing monitoring systems. To this end, the standard meteoro-
logical data of meteorological stations of the U.S. National Data Buoy Center were
also used.
The introduction of the characteristic I
Ω
in (3.37) and (3.38) facilitates the design
of the monitoring scheme and the prediction of the OAS phase transition. Fig-
ure
7.13
illustrates a possible structure of the monitoring system with functions of
the investigation, forecast, and tracing these processes (Krapivin et al. 2012b).
Thus, the system has three levels:
fixing, decision making and investigation. The
corresponding units have the following functions:


Search WWH ::

Custom Search