Geoscience Reference
In-Depth Information
Table 6.21 Estimations of
the biocomplexity indicator
n
Season
Layers
1
2
3
4
5
for the different layers in
the spring-summer season and
in winter
Spring-Summer
0.89
0.93
0.62
0.34
0.21
Winter
0.31
0.49
0.71
0.39
0.22
*
=
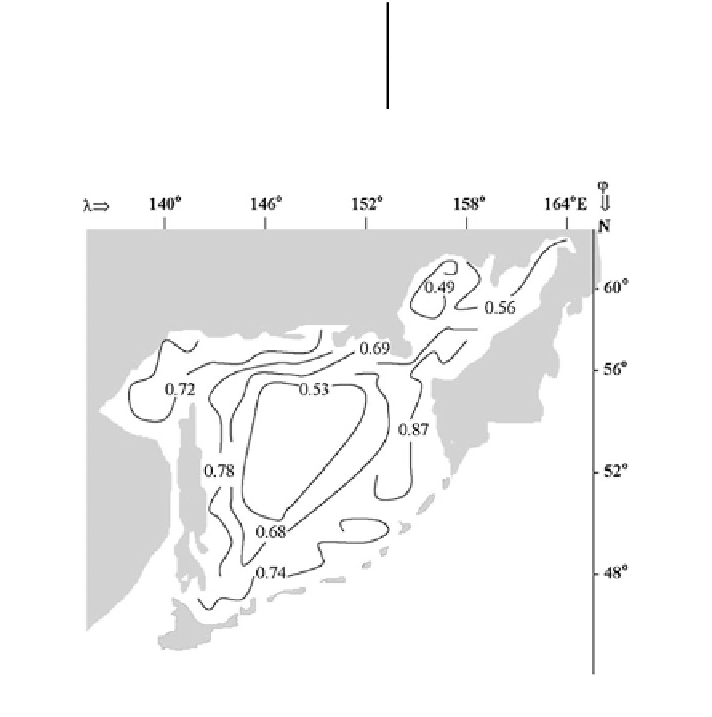
Fig. 6.21 Spatial distribution of biocoplexity indicator
ʾ
ʾ
/
ʾ
max
for the spring-summer time
Fig.
6.21
show an example of such a distribution. Comparison of this distribution
with the distribution of zones with industrial
fish accumulations (Terziev et al.
1993), shows that there is a correlation between these distributions.
In the common case, the indicator
ʾ
re
fl
ects the level of complexity of the
Okhotsk Sea ecosystem. A change
in is realized as a consequence of migration
processes and of the variability of nutritive interactions. The subsystem B
20
plays a
role in these processes as an external source of change in the other components.
These changes are interpreted in terms of
ʾ
fishing and other impacts causing vari-
ations in the biomass of the components.
Calculations show that basic variability in
¼
n=n
max
is caused by migration
processes, under which quick redistribution of the interior structure of the matrices
X and C
ij
n
occurs. For instance, according to Terziev et al. (1993) many
sh
species during spring time migrate to the shelf zone, and during winter time they
move to the central aquatories of the sea. Therefore, the value of
n
1 during
→
spring and
n
0.6 during winter
for
the shelf zone. This means that
the
→


Search WWH ::

Custom Search