Geoscience Reference
In-Depth Information
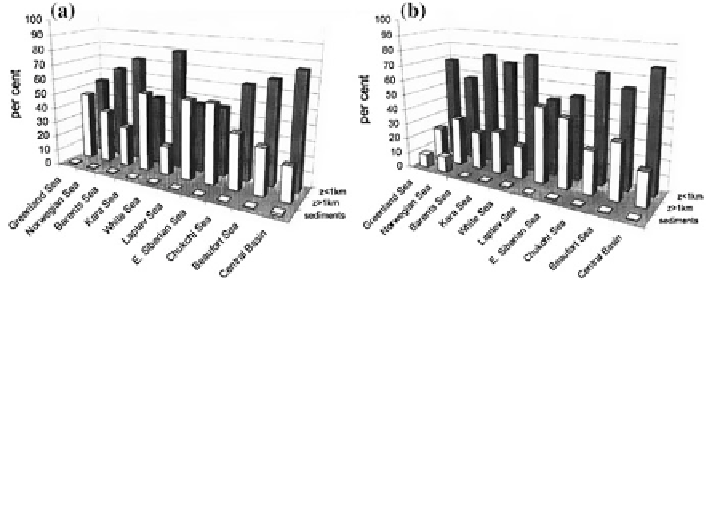
Fig. 6.16 Spatial distribution of oil hydrocarbons in the Arctic Basin 30 years (a) and 50 years
(b) after the beginning of the experiment. It is supposed that transformation of oil products is
realized by dissolution = 0.1 mg/m
3
/day, evaporation = 0.01 mg/m
3
/day, penetration into deep
water layers in the form of droplets = 0.01 mg/m
3
/day, oxidation = 0.02 mg/m
3
/day, adsorption by
a weighed organic substance = k
D
(D
A
)
1/3
(k
D
is the coef
cient of adsorption equal to zero for media
A = s, i
1
, i
2
and 0.005 day
−
1
in the medium A = w), biosidementation = k
Z
Z
1/4
(k
Z
is the coef
cient
of biosedimentation equal to zero for media A = s, i
1
, i
2
and 0.004 day
-1
in the medium A = w), and
bacterial decomposition = k
B
B
A
(k
B
is the coef
cient of bacterial decomposition equal to 0.01 for
media A = s, i
1
, i
2
and 0.05 day
−
1
in the medium A = w). D
A
is the detritus biomass, B
A
is
bacterioplankton biomass, Z is zooplankton biomass
(near the coastline, in the Bering Strait and at the southern boundary of the
Norwegian Sea). The concentration of heavy metals in phytoplankton is less by
18 % than in zooplankton and is higher by 26 % than in nekton. There is a process
of accumulation of heavy metals at the upper trophic levels. Besides, the ratio of the
concentration of heavy metals in phytoplankton to that at other trophic levels varies
from 0.3 in
Ω
R
∪Ω
P
to 0.5 in open waters.
The AYRSSM allows one to estimate the dependence of pollution level in the
AYRS estuary as a function of anthropogenic activity. Suppose that the intensity of
the sources of heavy metals is such that their concentration in the water near
Angarsk, Irkutsk, Krasnoyarsk, Bratsk and Ust-Ilimsk is described by a stationary
function, supporting the heavy metals concentration at the level h at each city
mentioned above. The computer experiments show that there is stable correlation
between h, the heavy metals concentration in the AYRS estuary, and the water
fl
ow
rate
. An increase in h of 10 % leads to a rise of pollution input to Kara Sea by
2.5 %. An increase in
ʼ
of 1 % leads to a rise of pollution input to Kara Sea by
0.7 %. These results are correct only when values
ʼ
ʼ
and h are varied near their
average estimates. Near their critical values the estimates are unstable and more
detailed models are required.
In conclusion, it is necessary to note that this study demonstrates the possibility
of using the modeling technology in the solution of complex environmental
problems, demanding the combination of knowledge from different scienti
fields.
The AYRSSM is one example of such a combination. It gives typical elements for
the synthesis of a simulation system for investigation of Arctic Basin pollution.
c
Search WWH ::

Custom Search