Geoscience Reference
In-Depth Information
From satellite observations (beginning from 1979), the trend of global average
temperature for the lower troposphere (0
C per 10 years (Christy
and Spenser 2003). According to the data of aerological soundings there was an
increase of the global average temperature of the lower troposphere by about 0.03
8 km) was +0.07
°
-
°
C
per 10 years, being much below the SAT increase (
C per 10 years) (Waple
and Lawrimore 2003). This difference in warming manifests itself mainly in the
oceanic regions in the tropics and sub-tropics, and it is not clear why such is the case
(Christy and Spenser 2003). The results of the numerical climate modeling show that
the global warming should be stronger in the free troposphere than near the surface.
The difference of temperature trends near the surface and in the troposphere has
caused heated discussion in the scienti
0.15
°
*
c literature (Christy and Spenser 2003;
Waple and Lawrimore 2003). Since the reliability of the satellite remote sensing
data raises no doubts, and their spatial representativeness (on global scales) is more
reliable than that of the data of surface measurements, this difference should be
interpreted as necessitating further analysis of the SAT and SST data adequacy.
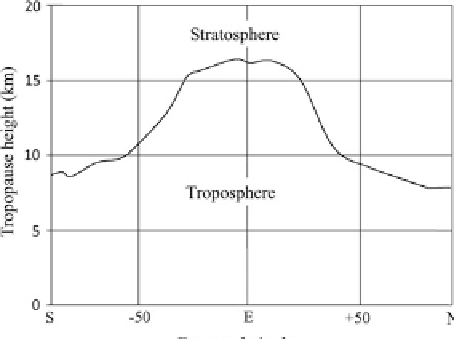
Data on changes in the height of the tropopause have recently attracted rapt
attention. The height of the tropopause depends on the location, notably the latitude,
as shown in the Fig.
5.5
. As Santer et al. (2003) noted, starting from 1979, the
height of the tropopause increased by several hundred meters, agreeing with the
results of numerical climate modeling, taking into account the growth of GHGs
concentrations, whose contribution prevails, again, in
agreement of the
observed and calculated data. As it follows from Fig.
5.4
the tropopause height does
not gradually drop from low to high latitudes. Rather, it drops rapidly in the area of
the subtropical and polar front jets (Linacre and Geerts 1997).
Studies of the dynamics of the tropical tropopause layer are of great interest for
quantitative estimates of climate change and an understanding of mechanisms for
the troposphere-stratosphere interactions. These circumstances have stimulated
recent serious attention to studies of the climatic structure and variability of the
tropical
“
enigmatic
”
tropopause, as well mechanisms responsible for the formation of this
Fig. 5.5 The height of the
tropopause
Search WWH ::

Custom Search