Geoscience Reference
In-Depth Information
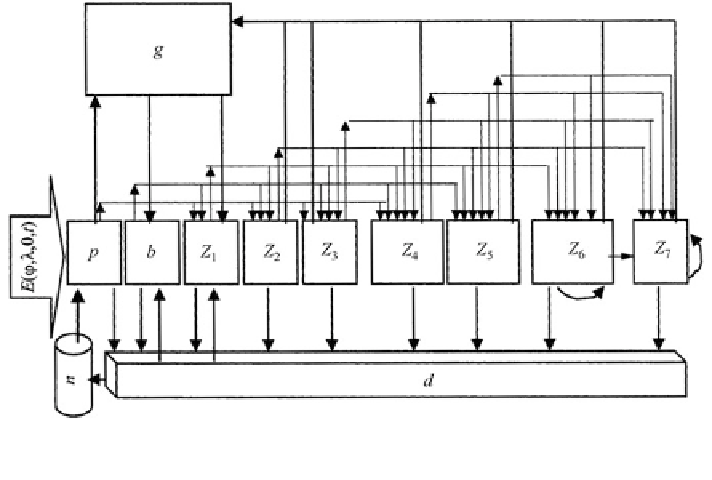
Fig. 4.17 The scheme of energy fluxes (cal/m
3
/day) through the community of pelagic organisms
residing in the 200 m surface layer in the oligotrophic tropical region of the World Ocean
Thus, the thermocline at an initial timemoment t = 0 is located in the layer 10
-
30m,
descending gradually down to 120
-
150 m on the 50th day and to 150
-
190 m on the
100th day.
The supply of nutrient elements in the layer 0
200 m is replenished at the
expense of detritus decomposition and emission of unassimilated food by living
elements of the community, as well as at the expense of the input from deep layers
(z > 200 m) due to turbulent mixing (coef
-
cient k
2
) and vertical advection (velocity
V
Z
). The content of nutrients in organic matter is constant and constitutes 10 %.
Taking into account the assumptions mentioned, the Eq. (
4.19
) becomes
h
i
1
10
0
:
1 n
0
:
6
R
p
¼ k
T
1
10
0
:
25p
cð
t
Þ
;
where the function
ʳ
(t) characterizes the time dependence of the production/bio-
mass ratio (p/b-coef
cient) for phytoplankton. If a maximum of p/b for phyto-
plankton at the point of upwelling (t = 0) is assumed to be 5, then the p/b-coef
cient
decreases and on the 15th day it reaches 1 and remains constant. Hence, the
Eq. (
4.25
) is rewritten:
t ¼ R
p
t
p
p
l
p
p
X
j
2x
0
n
p
2
p
@
@
z
2
@
p
=@
C
pj
R
j
þ
k
2
@
þ
V
z
w
p
p
=@
z
;
Search WWH ::

Custom Search