Geoscience Reference
In-Depth Information
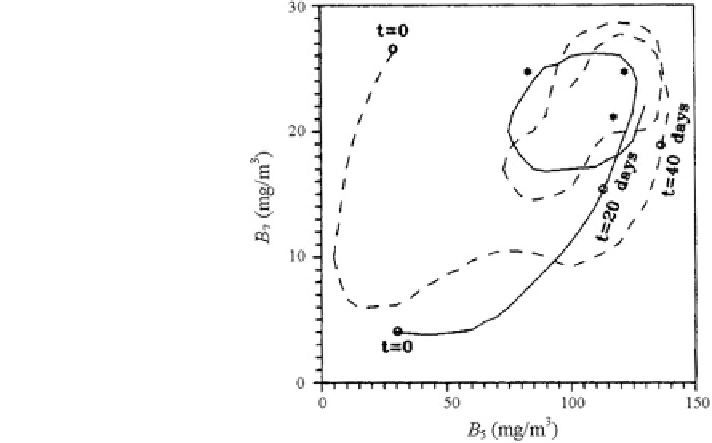
Fig. 4.9 Trajectories of the
PCE on the plane of B
5
×
B
7
under different initial states.
The asterisks correspond with
the data of Marti (1971)
model of Vinogradov et al. (1975), Vinogradov (1975). Additional conditions are
also taken into account as follows. Suppose that the difference
ʔ˃
φ
ʻ
(
,
, z, t) between
the water temperature above the thermocline (z < H) and
˃
A
linearly increases with
higher latitudes. This difference is
is
independent of longitude. The difference between the water temperature under the
thermocline (z>H) and the atmospheric temperature is independent of geographical
coordinates. Changes in the depth of the thermocline due to light
ʔ˃
(0,
ʻ
, z, t) = 0 and
ʔ˃
(30
°
S,
ʻ
, z, t)
≤
0.2
˃
A
.
ʔ˃
fluctuations should
be neglected. Then we shall use the parameter R as a free parameter to assign light
fl
fl
fluctuations.
Figures
4.10
and
4.11
give instances of the calculations of the vertical structure
of the PCE and J(t) for variations of light at the surface. These results point to the
presence of a regularity observable throughout the area and are indicative of the
increase of E(
φ
,
ʻ
,0,t). If, in general, in the case of the biosphere a 2 % reduction in
E(
φ
,
ʻ
,0,t) is likely to result in glaciations. In the case of the PCE,
fl
fluctuations of
E(
60 % to +700 % (Fig.
4.11
) are safe for this system. This effect
has a local character when the safe level is de
φ
,
ʻ
,0,t) within
−
0.5. This
condition corresponds to the situation when the system loses more that 70 % of
biomass. The integral result from such effects can be understood only in the
framework of GIMS.
The function E(
ned by the condition J(t)
≥
,0,t) in Eq. (
4.48
) depends on the state of the atmosphere.
The simulation experiments show that the PCE survivability permissible reductions
of the atmosphere transparency must not be more than 2.5 times. Above this
threshold the system is bound to perish.
The role of oxygen is taken into account by the model in terms of production,
mortality rates and spending on energy exchange within the environment. Simula-
tion experiments point to great inhomogeneities of the saturation of waters with
φ
,
ʻ
Search WWH ::

Custom Search