Geoscience Reference
In-Depth Information
which can be used in the framework of other procedures. Table
3.3
shows the
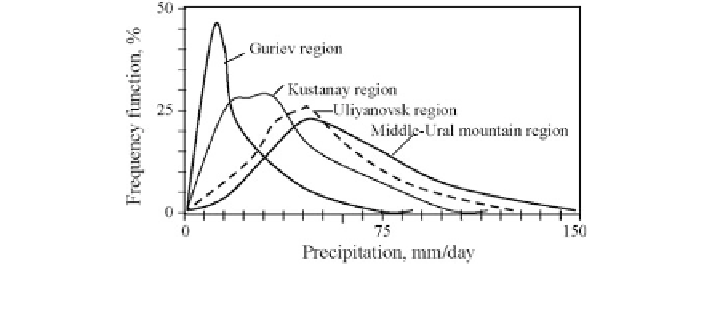
advantage of such an approach. Figure
3.15
gives the results of reconstructions of the
empirical distribution for precipitation in three regions of the Russian Federation and
Kustanay in northern Kazakhstan. The parameters for these distributions are given in
Table
3.4
.
Table 3.3 Results of the data processing concerning the temperature anomalies for the arctic
atmosphere (during the last 10 years)
Season
M
1
M
2
M
5
M
6
NW
ʔ
, %
Distribution
Winter
0.02
0.29
0.16
0.41
44
56
K
Spring
0.08
0.87
−
0.52
0.05
108
0
St
Summer
0.00
0.39
−
0.01
−
0.65
51
49
Si
Autumn
0.09
0.64
0.11
4.74
73
27
G
0.75 59 41 G
Notation: M
1
is the first order moment (mean), M
2
is the central second order moment (dispersion),
M
5
is the asymmetry coefficient, and M
6
is the excess coefficient, NW is the number of the
measurements in the framework of the sequential procedure,
ʔ
is the advantage of the sequential
procedure in comparison with the fixed level of 100 measurements in the classical procedure, G is
the Gaussian distribution, K is the Cauchy distribution, Si is the Simpson distribution and St is the
Student distribution
Year
0.05
0.55
0.26
−
Fig. 3.15 Empirical distributions of the precipitation in four regions of Russia and Kazakhstan
estimated by means of the sequential procedure. The distribution parameters are given in Table
3.4
Table 3.4 Estimations of the distribution parameters for precipitation (mm month
-
1
) in three
regions of the Russian Federation and in Kustanay, Kazakhstan
Region
Variation coefficient
Distribution
Mean
Dispersion
Uliyanovsk
16
Pearson
310
51
Middle-ural mountains
15
Pearson
435
67
Guriev
31
Pearson
109
33
Kustanay
31
Pearson
211
61


Search WWH ::

Custom Search