Geoscience Reference
In-Depth Information
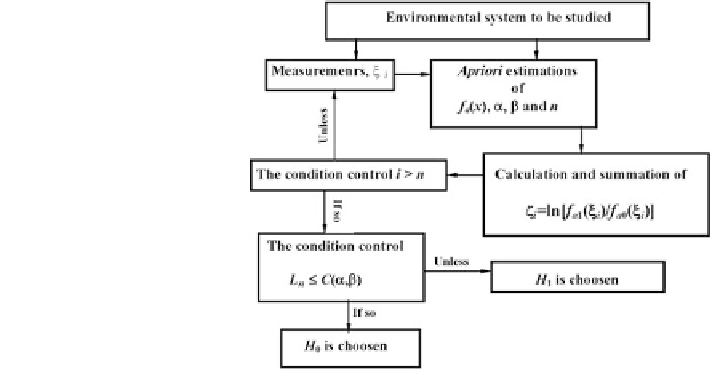
Fig. 3.1 Classical Neyman-
Pearson decision-making
procedure to choose between
the two hypotheses H
0
and H
1
true. In this case, the parameter a of the real density f
a
can be equal to neither a
0
or a
1
.
Errors of the
first kind,
a
, and the second kind,
b
, satisfy the following formulas
respectively:
5
fð
E
a1
n
E
a0
nÞð
D
a0
nÞ
1
=
2
2
n
;
a
exp½
0
:
g
ð
3
:
2
Þ
b
exp½
0
:
5
fð
E
a1
n
E
a0
nÞð
D
a1
nÞ
1
=
2
2
n
;
g
ð
3
:
3
Þ
where
Z
1
E
a
n
¼
ln f
a1
ð
x
Þ=
½
f
a0
ð
x
Þ
f
a
ð
x
Þ
dx
ð
3
:
4
Þ
1
Z
1
2
f
a
ð
x
Þ
dx
E
a
ðÞ
2
D
a
n
¼
f
ln f
a1
ð
x
Þ=
½
f
a0
ð
x
Þ
g
ð
3
:
5
Þ
1
Neyman-Pearson theory focuses on testing a statistical hypothesis provided that
the volume of observations allows the calculation of basic statistical characteristics
including the empirical distribution function. In this case, theoretical probability
density function f
a
(x) is assessed on the base of
2
-criterion. Unfortunately,
empirical results of environmental monitoring usually do not satisfy this condition.
In this case a sequential procedure is used where the sample size is not
ˇ
fixed in
advance. Instead, data are evaluated as they are collected, and further sampling is
stopped in accordance with a pre-de
cant results
are observed. Thus, a conclusion may sometimes be reached at a much earlier stage
ned stopping rule as soon as signi
Search WWH ::

Custom Search