Geoscience Reference
In-Depth Information
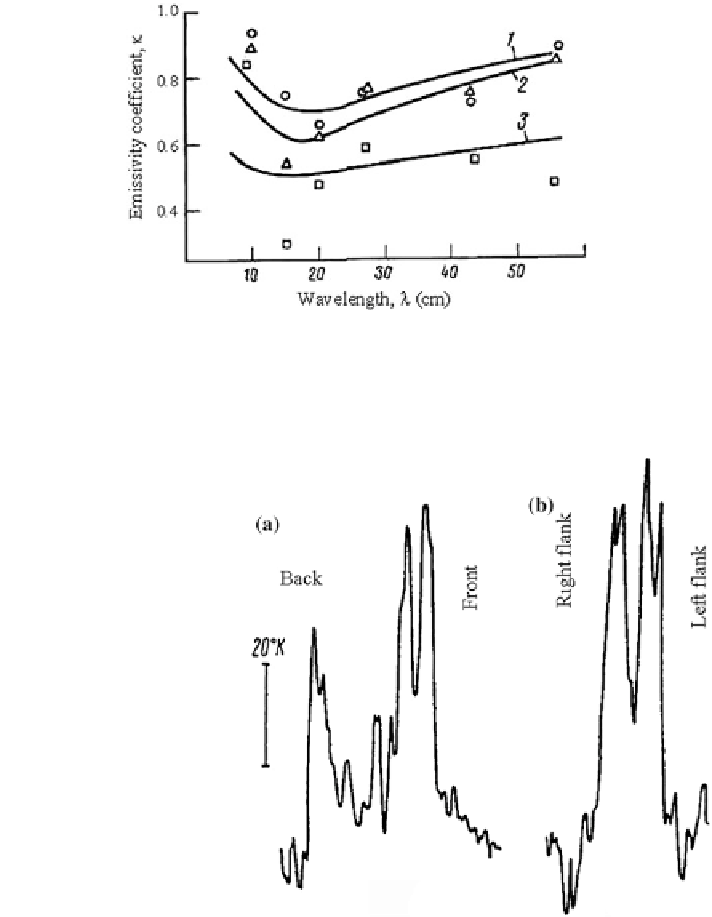
Fig. 2.20 Spectral dependence of peat emissivity coef
cient under weighed moisture: 1
—
45 %
(marker of measurement data is circle); 2
—
53 % (marker of measurement data is triangle);
3
—
78 % (marker of measurement data is square)
Fig. 2.21 Spectral
characteristics of slash
re
(chain line), peat bog (solid
line), and sphagnous bog
(dotted line) in dynamics of
drying and moistening: 1
—
during rainfall; 2
—
after
heavy rainfall; and 3
—
2 days
later rainfall
activity and classifying geophysical structures in areas where geothermal sources are
active. In such areas the water content of rocks is insigni
cant and, hence, the depth of
electromagnetic wave spread is increased to equal the inverse value of the absorption
coef
cient per unit of depth z. Multi-channel measurements based on use of the
microwave range use and application of GIMS technology allow soils to be
reliably classi
ed and thermal situations mapped. Figure
2.23
demonstrates
the map of Tolbachik volkano zone (Ostry Tolbachik
—
55
°
57
′
N, 160
°
25
′
E;
Search WWH ::

Custom Search