Geoscience Reference
In-Depth Information
Table 2.19 Values of coef
cients in (
2.6
)
Vegetation
a
EWT
b
EWT
R
EWT
a
FMC
b
FMC
R
FMC
Nerium oleander var.indicum
−
0.10697
0.62268
0.82
155.89
−
34.087
0.06
Betula platyphylla var.japonica
−
0.03136
0.3339
0.88
135.59
212.72
0.26
Liriodendron tulipifera
−
0.00951
0.17521
0.87
68.312
539.65
0.56
Others
−
0.02442
0.27963
0.79
119.42
204.69
0.28
Maki et al. (2004) proposed linear approximations:
EWT
¼
a
EWT
þ
b
EWT
NDWI
;
FMC
¼
a
FMC
þ
b
FMC
NDWI
ð
2
:
6
Þ
coef
cients of which are shown in Table
2.19
.
Experimental
fire dangerous assessment are represented in
Figs.
2.17
,
2.18
,
2.19
,
2.20
and
2.21
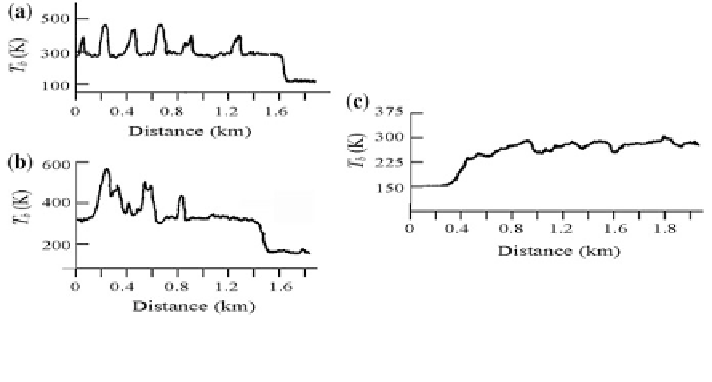
. Figure
2.16
shows pro
results of
the
le of radio-brightness
temperature
fixed by means of radiometer 0.8 cm under monitoring of burned peat
piles, peat bog and forest
fire. Increase of radio-brightness temperature for case of
burned peat piles equals to 100
200 K. Increase of radio-brightness temperature for
case of peat bog monitoring is 100
-
-
300 K. Finally, increase of radio-brightness
temperature for forest
fire case is 30
-
70 K. These variations exceed levels of phone
radiation variations (5
5 K).
Figures
2.18
and
2.19
show radio-thermal specters of peat bogs from which it is
followed that emissivity coef
-
20 K) and equipment noise (1
-
cient of peat bog has anomalous decrease for
wavelengths 10
-
20 cm and has considerable increase of absorption coefficient.
These features follow from capillary-porous peat structure with abrupt differences
of volumetric and dielectric characteristics of peat particles in space between of
which there exist large quantity of coupled water and air.
Fig. 2.17 Profiles of radio-brightness temperature at the wavelength 0.8 cm received under remote
sensing measurements above the stacks of burning peat (a), fuming peat bog (b), and forest fire (c).
Level 150 K corresponds to radio-brightness of water surface


Search WWH ::

Custom Search