Geoscience Reference
In-Depth Information
Table 1.15 Methane emissions from different sources recalculated for carbon equivalent (EPA
2001)
Anthropogenic source of methane
1990
1995
2000
2005
2010
Output of natural gas and oil
181.1
177.0
185.2
186.9
190.2
Animals
'
vital functions
157.4
143.4
144.0
149.5
150.8
Solid waste heaps
136.9
131.4
133.9
134.4
135.5
Coal mines functioning
82.8
62.6
59.0
59.3
59.0
Processing of stock-breeding waste
27.9
26.8
28.1
29.2
29.8
Sewage processing
10.1
9.8
9.8
10.4
10.4
Other sources connected with agriculture
7.9
8.2
8.5
8.2
8.2
Industrial and municipal sectors
15.0
13.9
13.7
13.9
14.8
fluxes are given in 10
6
t C year
−
1
Estimates of methane
fl
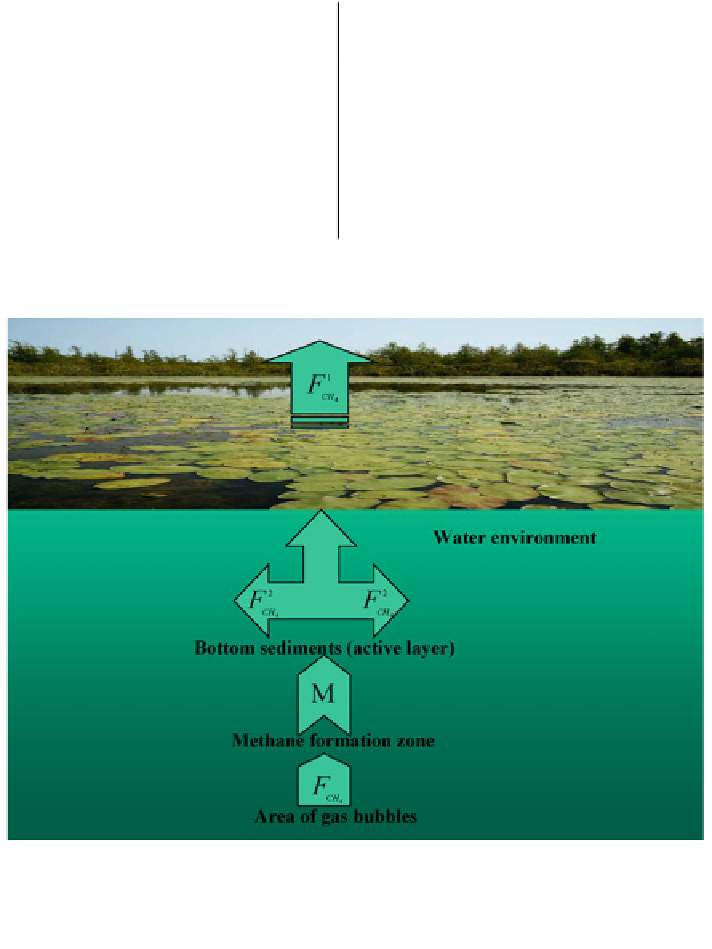
Fig. 1.39 Block-diagram for formation and transport of methane in the waterlogged country.
Notation: F
CH
4
is the methane flux across the atmosphere/water body interface; F
CH
4
is the
oxidation of methane in aerobic zone; F
CH
4
is the intensity of methane source; M is the methane
concentration
oxidation use the released energy E for the organic matter synthesis. The remaining
methane gets to the atmosphere and, in contrast to CO
2
, practically does not return
to the water medium. This is somehow connected with the fact that the CH
4
solubility in water is almost 40 times lower than that of CO
2
. The lifetime
˄
H
of


Search WWH ::

Custom Search