Information Technology Reference
In-Depth Information
100%
100%
A
A
B
B
C
C
Time
Time
(a)
(b)
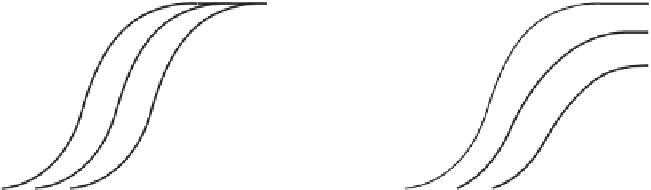
FIGURE 10.11
Two models for technological diffusion. In both models the most advantaged
group A is the first to adopt a new technology, while the least advantaged group C is the
last to adopt it. (a) In the normalization model, the technology is eventually embraced by
nearly everyone in all groups. (b) In the stratification model, the eventual adoption rate of
the technology is lower for less advantaged groups.
in a society, based on their socioeconomic status (Figure 10.11). We divide society into
three groups. People with the highest socioeconomic status are in group A, people with
the lowest socioeconomic status are in group C, and group B consists of those people in
the middle.
In the
normalization model
(Figure 10.11a), group A begins to adopt the tech-
nology first, followed by group B, and finally group C. However, at some point nearly
everyone in all three groups is using the new technology.
In the
stratification model
(Figure 10.11b), the order of adoption is the same.
However, in this model the eventual number of people in group C who adopt the
technology is lower than the number of adoptees in group A. The percentage of people
in group B who adopt the technology is somewhere between the levels of the other two
groups.
Technological optimists believe the global adoption of information technology will
follow the normalization model. Information technology will make the world a better
place by reducing poverty in developing countries. Creating opportunities elsewhere will
reduce the number of people trying to immigrate into the United States.
Technological pessimists believe information technology adoption will follow the
stratification model, leading to a permanent condition of “haves” and “have nots.”
Information technology will only exacerbate existing inequalities between rich and poor
nations and between rich and poor people within each nation [62].
Technological pessimists point out that the gap between the richest 20 countries and
the poorest 20 countries continues to grow. In 1960 the average gross domestic product
(GDP) of the richest countries was 18 times larger than the average GDP of the poorest
countries. By 1995 the gap had grown to 37 times greater. Some of the poorest countries
grew even poorer during the last third of the twentieth century [28].