Geography Reference
In-Depth Information
dynamics of domestic and international tourist activity. This section can provide only a
limited evaluation of the geographer's approach to analysis of the presentation of
spatially oriented insights on modern-day tourism demand (for more detail consult
D.G.Pearce 1995a).
PATTERNS OF GLOBAL TOURISM
The WTO provides the main source of data for international tourism, collated from a
survey of major government agencies responsible for data collection. While most
international tourists are expressed as 'frontier arrivals' (i.e. arrivals determined by
means of a frontier check), arrival/ departure cards (where used) offer additional detail to
the profile of international tourists, and where they are not used periodic tourism surveys
are often employed. WTO statistics are mainly confined to all categories of travellers,
and in some cases geographical disaggregation of the data may be limited by the
collecting agency's use of descriptions and categories for aid of simplicity (e.g. rest of the
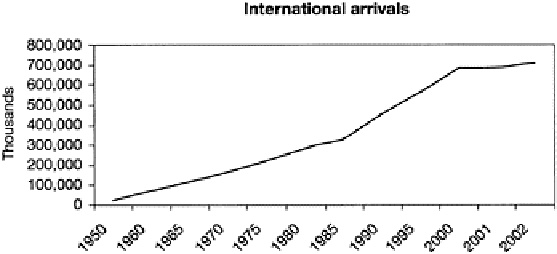
world) rather than listing all categories of arrivals. In terms of the growth of international
travel, Figure 2.12 documents the expansion of outbound travel with constant growth in
the 1960s in an age of discovery of outbound travel for many developed nations. The late
1960s saw international travel expanded by new technology in air travel (e.g. the
introduction of the Boeing 747 jumbo jet and the 737 as well as the DC10) which led to
rapid growth until the oil crisis in the early 1970s. Growth rates varied in the 1980s, with
'shock waves' to the upward trend being caused by events such as the Gulf Crisis, but
international travel has maintained strong growth rates, often in excess of 5 per cent per
annum until the late 1990s, where the growth rates have slowed down considerably.
However, as Figure 2.13 shows, the growth in international receipts from travel
outperformed arrivals up until the late 1990s, with consistent rates of growth (with the
exception of the oil crisis and Gulf Crisis) of 10 to 20 per cent which is indicative of the
Figure 2.12:
Growth off international
arrivals, 1950-2002
Source:
based on WTO data