Biomedical Engineering Reference
In-Depth Information
(a)
(b)
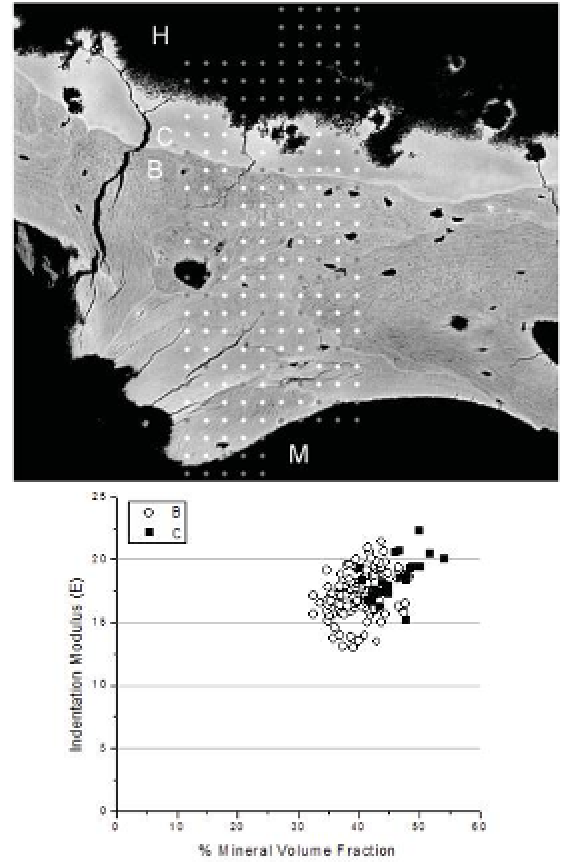
Figure 7-6. (a) qBSE image of normal, post-mortem human femoral head tissue including
hyaline articular cartilage (H), articular calcified cartilage (C), immediate subchondral
bone (B), and marrow space (M). Calibration standards were used to scale images and
calculate mineral volume fraction (black = 0% mineral
V
f
).
50,108,127
Each indent site was
assigned a tissue type (white spots), or discarded from analysis (grey spots), based on
overlay of an indentation grid map. Fieldwidth = 594
m. (b) Indentation modulus versus
min
V
f
plotted for valid B or C sites within the two 5 × 24 indent arrays (20 μm spacing
in x- and y-directions) shown in top panel demonstrate the anticipated positive correlation
between
E
and mineral
V
f
and different ranges of behavior for the more poorly
mineralized B versus C. Image (a) used with permission from Ferguson
et al.
, J. Anat
2003).
50
μ
Search WWH ::

Custom Search