Geography Reference
In-Depth Information
$
Salop Monopoly
p
M
Salop Competition
q
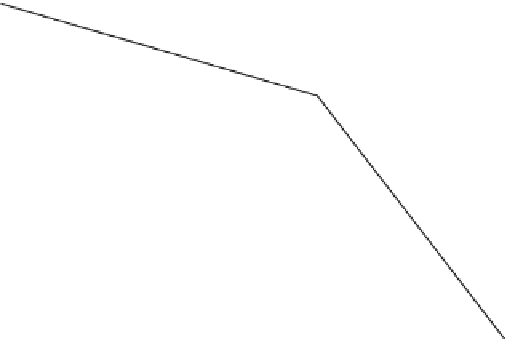
Figure 3.21
Demand in a Salop model
tq
c
L
t
n
P
2
p
1
5
(3.22)
Rearranging equation (3.22) gives:
L
t
c
t
n
q
c
5
1
P
2
p
d
(3.23)
Once again, differentiating the quantity demanded and sold with respect
to the price gives:
q
c
0
52
L
0
t
(3.24)
p
As we see in equation (3.24) the competitive quantity demanded falls
by
- L/t
as the price
p
rises by $1.
If we compare equation (3.24) with equation (3.18) we see that the effect
of a price rise of $1 by one firm in the Salop monopoly model depicted in
Figure 3.19 is twice as great as the effect of a $1 price rise in the competitive
Salop model depicted in Figure 3.20. This is represented in Figure 3.21.
The reason for this is that in a competitive model the consumers have
the possibility to switch consumption between producers whose products
are immediately adjacent to their preferred brand or combination of
characteristics. As such, a more competitive market with more brands