Geography Reference
In-Depth Information
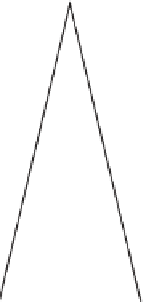
Distance
x
d
m
d
m
Figure 3.19
Monopoly region Salop model
all brands. As is clear from Figure 3.19, the market area of a firm will not
impede on the market area of any other firm. The total market area for
each firm will then depend on the rate of decline of utility with respect to
differences in product characteristics.
In contrast, in the competitive region case depicted in Figure 3.20,
competing firms producing competing brands must take account of their
rivals. In this situation, there will be customers whose preferences are
located in the potential market area of two competing brands, and rational
consumers will buy from the firm whose brand offers the highest consumer
surplus. In Figure 3.20 the monopoly area of the firm reflected in the dis-
tance of the market boundary between two competing brands is given as
2
d
c
. In this quasi-competitive brand case, the market area is obviously less
than the pure brand monopoly case depicted in Figure 3.19.
Part of the problem here is that if there are 'gaps' between the firms,
as depicted in Figure 3.19, then this implies that there are market niches
into which new competitor firms may enter. However, the new entrant
firms will not want to be confined into selling purely in the market niches
defined by the empty spaces between the existing firms as this will limit
their market potential, unless the gaps are very large. If this is not the
case, then entrant firms will also aim to encroach on the market regions
of the incumbent firms, thereby transforming the monopoly region model
of Figure 3.19 into something more akin to the competitive region model