Biology Reference
In-Depth Information
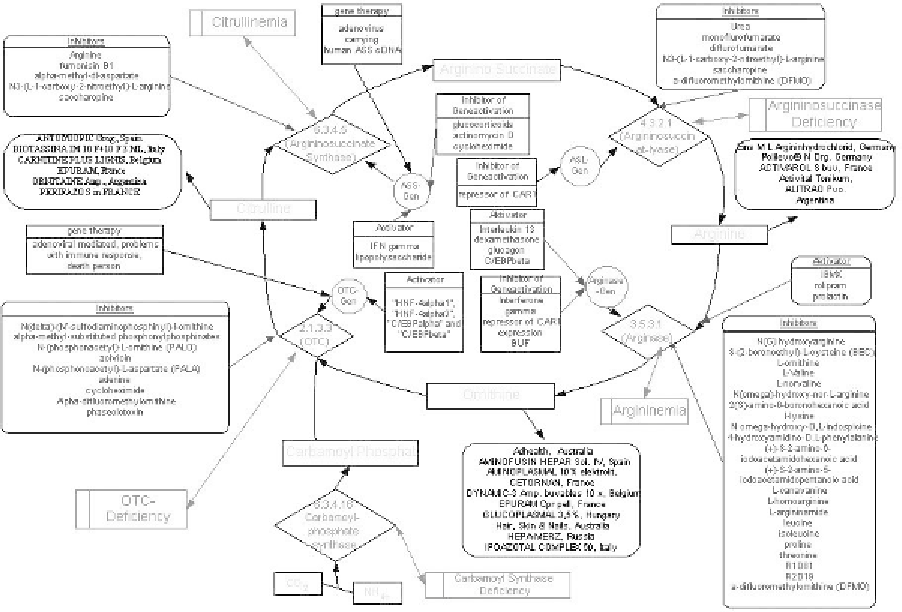
Fig. 7. Schematic diagram of urea cycle metabolic network. Data sources: Metabolic pathway (enzyme reactions) from
KEGG and BRENDA; Gene regulatory: TRANSFAC; Drug information: Metabolic Diseases Drug Database (MDDrugDB)
it into ornithine to make citrulline. Citrulline is then transported to the cytosol where aspartate is added.
As urea is removed it is converted back to ornithine that goes back into the mitochondria to start over.
Deficiencies in the urea cycle enzymes lead to excessive NH
4
and accumulation of its intermediates,
resulting in neurological disorders. Any of five enzymes of the urea cycle may be deficient and
lead to carbamyl phosphate synthetase (CPS) deficiency, ornithine transcarbamylase (OTC) deficiency,
citrullinemia, argininosuccinic aciduria and argininemia.
Although the urea cycle was discovered by Hans A. Krebs early in 1930's, the modeling and simulation
of the urea cycle so far have never been systematically explored. This case study therefore will attempt
to model and simulate it. A model will show the interrelations of main metabolites invovled in the urea
cycle. The simulation will be used to test the physico-chemical limitations and feasibility of certain
proposed reactions as well as disease occurrences.
Figure 7 shows a graphical representation of the urea cycle metabolic network using the objects
presented above for describing entities and interactions. It shows an intricate network that links entities
and interactions. This network includes not only the succession of biochemical reactions that lead to
the transformation of CO
2
and NH
4
to urea, but also the regulation of gene expression and enzymatic
activities. It furthermore displays (e.g. asparate, fumarate) the links to other pathways, which are not
detailed on the graph to preserve clarity.