Biology Reference
In-Depth Information
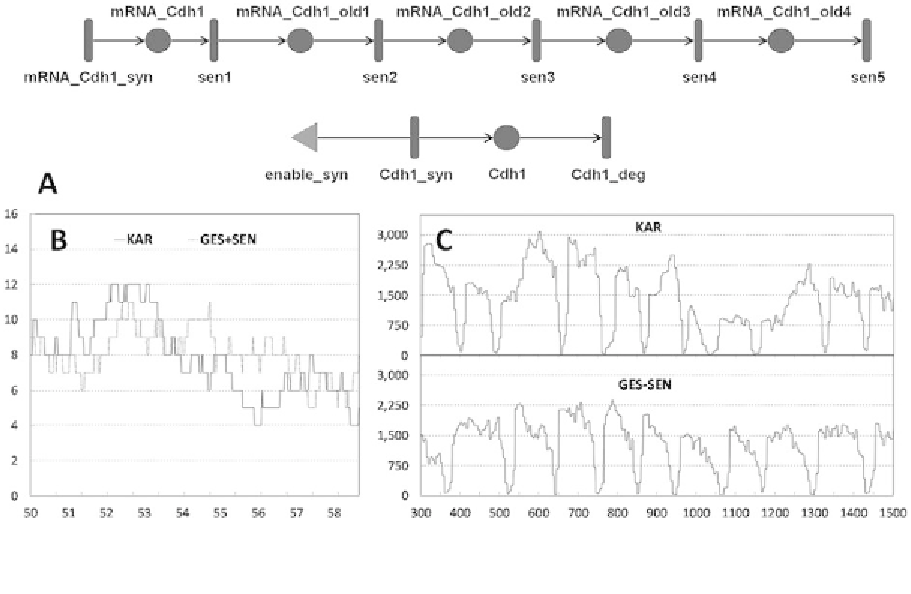
Fig. 2. Simulating fluctuations in Cdh1 mRNA and unphosphorylated protein levels. (A) Screenshot of the Mobius tool [33],
showing the implementation of five step gestation and five step senescence of Cdh1 mRNA and single step translation and
degradation of Cdh1 proteins, with the enable syn. input gate (triangle) to stop the translation process when the total number
of mRNA molecules is 0. (B) Simulation curves of Cdh1 mRNA levels in two variants of the model (KAR-solid line,
GES
+
SEN-dotted line). (C) Simulated time courses of total unphosphorylated Cdh1 protein levels (the sum of the depicted
forms on Fig. 1) for model KAR and GES
+
SEN.
N
=
M
=
1 (model “KAR”), which is structurally equivalent to the one originally studied by Kar
et al.
in [20].
To encode
N>
0 steps of Cdh1 mRNA gestation in the Petri net model, we assign transition
Cdh1 mRNA syn in Fig. 2A (modeling the Cdh1 mRNA synthesis), a firing time that follows the Erlang
(
N
,1/
k
smy
) distribution. The Erlang distribution is a convenient modeling shorthand for representing
cascades of identical exponential stages [34]. Thus, if a random event occurs after
N
consecutive
steps, each one following the same negative exponential distribution of its occurrence time, the overall
occurrence time of the event (the sum of the
N
identically distributed exponential times) will be distributed
as an Erlang random variable. For the purposes of our modeling, the stages are
N
, each stage having an
expected time of 1/
N
k
smy
. Therefore, the overall average firing time of transition Cdh1 mRNA syn
(the sum of the
N
average times of the constituting steps) is 1/
k
smy
, equal to the one of the KAR model.
A clear difference between the two models is that the
CV
of an Erlang of
N
stages is
N
−
1
/
2
, and thus
decreases as
N
grows, whereas the
CV
of a negative exponential random variable is equal to 1, always
larger or equal than that of an Erlang variable with the same average value.
When
M>
0, the multiple steps of senescence are explicitly represented in the Petri net model through
the exponentially distributed transitions sen1, sen2,
...
, senM, each step of senescence occurring at an
equal rate constant given by
M
·
k
dmy
. The model in Fig. 2A shows
M
=
5 steps of mRNA senescence.
Notice that again, the average degradation time of each mRNA molecule is not changed with respect to the
one used in the KAR model. The M obius modeling tool supports the Erlang distributed transitions, but
·


