Biology Reference
In-Depth Information
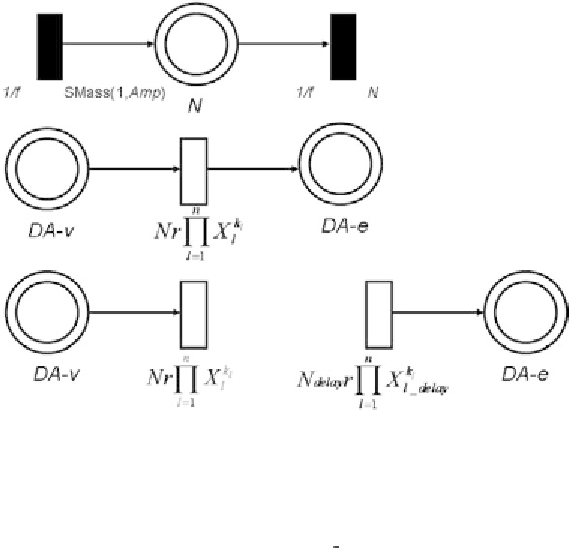
Fig. 3. Implementation of noisy and delayed processes in a hybrid GMA-HFPN model. Top panel: The diagram indicates a
mechanism with which we simulate random perturbations. The procedure generates a sequence of random numbers, representing
noise
N
of frequency
f
and amplitude
Amp
. SMass(1,
Amp
) is a Cell Illustrator function producing Gaussian distributed random
numbers with mean 1 and standard deviation
Amp
. Center panel: The diagram indicates how a non-delayed flux with rate
constant
r
is affected by noise
N
. Bottom panel: On the left, noise is applied to dopamine release. On the right, delay is assumed
to have happened during dopamine translocation, and
N
delay
and
X
l delay
are the delayed values of
N
and
X
l
, respectively.
Due to space limitations, the specific implementation of delays is not shown here; however, it follows directly the principles
discussed in [15,16]. It is noted that the creation of noise can also be accomplished with generic elements in the more flexible
HFPNe variant of hybrid Petri nets.
Simulation of dopamine flux in response to calcium signals
As indicated in Fig. 1, the presynaptic neuron receives signals from other neurons in the form of action
potentials, which in turn lead to a rapid calcium influx that ultimately causes a release of dopamine from
the presynaptic vesicle pool (DA-v) into the extracellular pool (DA-e). The mechanistic details of this
Hodgkin-Huxley type activation are immaterial here, and only the overall effect needs to be modeled.
Typically, the dopamine response follows a regular train of signals, which is often described as a spiking
pattern. To represent this repeated triggering effect in our model, we multiply dopamine efflux (from
DA-v to DA-e) with the following function:
bolus
sin
π
(
t
−
t
0
)
+1
,t
∈
[
t
0
,t
0
+
w
1
]
signal
(
t
)
=
w
1
(2)
1
,
else
The function has a baseline level of 1, which represents the resting state of the signaling system. A true
signal appears during the time window [
t
0
,
t
0
+
w
1
], where it rises and falls according to the positive
portion of the sine function and up to a maximum height of (
1+
bolus
). For a train of
n
signals, we
assume the distance between two subsequent signals to be
w
2
. According to [21], realistic values for
w
1
and
w
2
are at the order of tens or hundreds of milliseconds (ms) and a suitable bolus value is between 20
and 40.