Information Technology Reference
In-Depth Information
10000
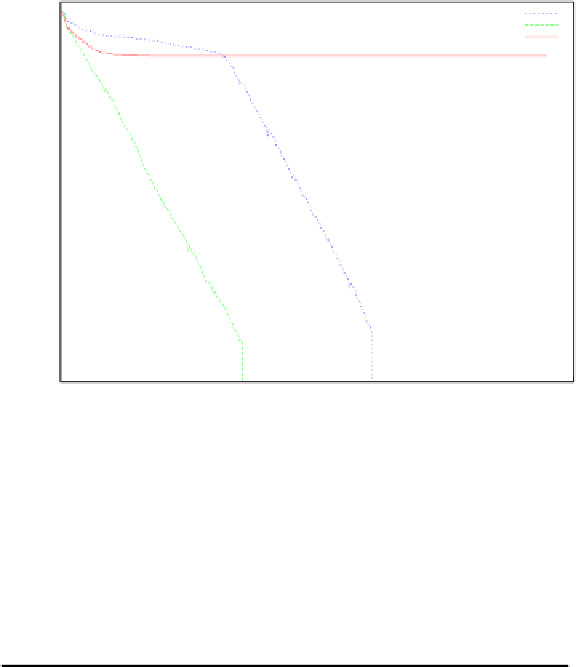
BMO on 2.40
DMO on 2.40
ES on 2.40
100
1
0.01
0.0001
1e-006
1e-008
1e-010
1e-012
1e-014
0
50
100
150
200
250
300
350
generations
Fig. 4.8.
Comparison between BMO, DMO and ES on problem 2.40. Typical runs
are shown on a logarithmic scale. While the standard ES early suffers from premature
steps size reduction, BMO and DMO show logarithmically linear approximation of the
optimum.
Table 4.13.
Experimental results of the BMO variants on the constrained function
g04. BMO and DMO achieve a satisfying approximation while the ES is outperformed.
ES
BMO
cBMO
DMO
best
-30665.53867 -30665.53867
-30665.53867 -30665.53867
median -30665.53227 -30665.53867
-30665.53867 -30665.53867
worst
-30644.23102 -30665.53867
-30662.83143 -30665.53867
mean
-30664.23109
-30665.53867
-30665.41105
-30665.53867
dev
4.3651
0.0005
0.5403
0.0003
bias
does not offer the necessary degree of freedom to shift the mutation ellipsoid
appropriately.
A comparison of the BMO variants and ES with DP shows figure 4.9, where
typical runs on problem g04 are drawn. BMO and DMO are able to approximate
the optimum, while BMO is faster. This run of the ES fails. The results are
similar to the behavior on problem 2.40. The results of 25 runs of all algorithms
on problem g04 are shown in table 4.13. Again, the ES does not show satisfying
results, the cBMO is slightly better. But BMO and DMO reach the optimum
in every run with a small standard deviation. Similar results were obtained on
other constrained functions.


Search WWH ::

Custom Search