Information Technology Reference
In-Depth Information
1e+250
BMO on parable ridge
cBMO on parable ridge
DMO on parable ridge
ES on parable ridge
1e+200
1e+150
1e+100
1e+050
1
0
200
400
600
800
1000
generations
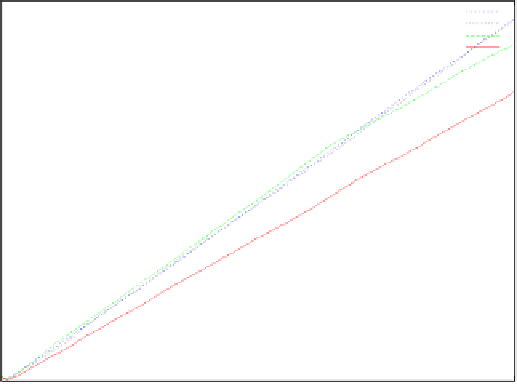
Fig. 4.7.
Comparison of the biased mutation variants and the unbiased standard
mutation on the parabolic ridge. The figure shows the absolute value of the fitness
development of typical runs on a logarithmic scale and reveals the superiority of the
variants BMO, cBMO and the DMO.
Parameter Study of
γ
Again, we test the influence of the strategy variable mutation parameter
γ
on
the function sharp ridge and observe remarkable effects, see table 4.10. Settings
around the recommendation
γ
=0
.
1, i.e. 0
.
05
0
.
15 achieve the best results.
With these settings the BMO is much faster moving along the ridge axes in best,
worst and average. In the range of 0
.
15
≤
γ
≤
0
.
05 the probability to adjust the
bias adequately is very high and results in an increase of the optimization speed.
These settings for
γ
correspond with the settings for other problem classes, i.e.
the constrained problems, see section 4.5.3.
≤
γ
≤
Table 4.10.
Parameter study of
γ
for the BMO on the function sharp ridge. Values
around
γ ≈
0
.
1 achieve the fastest convergence speed.
0.001
0.01
0.05
0.1
0.15
0.5
1.0
best
-1.7E+193 -1.7E+193 -4.0E+236
-1.9E+234
-7.4E+233
-1.1E+216 -1.9E+197
median -4.2E+181 -4.2E+181 -7.3E+227
-8.4E+229
-7.0E+226
-1.6E+204 -3.7E+190
worst
-1.8E+167 -1.8E+167 -4.8E+215
-6.2E+206
-2.9E+216
-9.5E+194 -6.3E+180
mean
-7.0E+191 -7.0E+191
-3.3E+235 -1.0E+233 -3.0E+232
-4.6E+214 -8.0E+195


Search WWH ::

Custom Search