Information Technology Reference
In-Depth Information
Table 3.1.
Experimental comparison of an ES with a fixed step size on the 2-
dimensional sphere function and the self-adaptive step size control (SA-ES) on a 30-
dimension sphere function. The SA-ES shows outstanding results in comparison to the
ES with constant step sizes.
Experimental settings
Population model
(15,100)
standard,
n
σ
=
N
,
τ
0
=(
√
2
n
)
−
1
and
τ
=(
2
√
n
)
−
1
Mutation type
intermediate,
ρ
=2
Crossover type
Selection type
comma
Initialization
[-100;100]
Termination
1000 generations
best worst mean dev
ES
σ
=0
.
1 2.77E-05 2.55E-03 9.72E-04 0.00058
ES
σ
=0
.
001 3.57E-08 1.11E+02 1.20E+01 25.30838
SA-ES
2.92E-56 3.71E-50 3.36E-51 8.27E-51
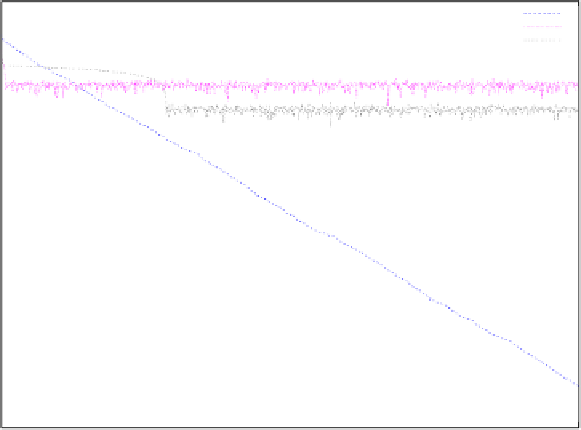
1e+010
SA-ES on 30-dim sphere
ES with sigma=0.1 on 2-dim sphere
ES with sigma=0.001 on 2-dim sphere
1
1e-010
1e-020
1e-030
1e-040
1e-050
1e-060
0
200
400
600
800
1000
generations
Fig. 3.5.
Plot of typical runs of the variants ES with constant mutation strength (
σ
=
0
.
1and
σ
=0
.
001) and the self-adaptive ES on the sphere function. The approximation
abilities of the self-adaptive process are outstanding in comparison to the ES with
constant step sizes. The approximation abilities of a SA-ES on the 2-dimensional sphere
function - not displayed here - go beyond the accuracy of the data structure after a
few hundred generations.


Search WWH ::

Custom Search