Agriculture Reference
In-Depth Information
8
6
4
2
0
0
2
4
6
8
1
0
2
4
Years
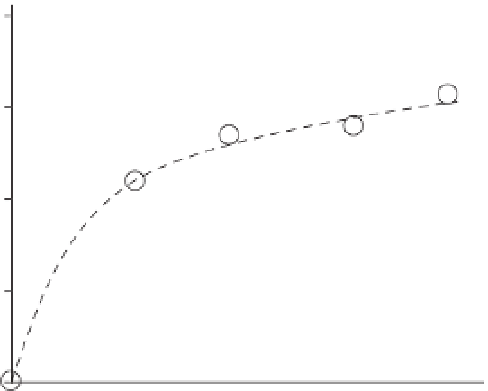
Fig. 3.5.
Sequestration of pasture-derived C
4
-C (mg C g
−
1
bulk soil) with time of pasture introduction on
original C3 vegetation. (From Zach
et al
., 2006.)
Local versus global effects of land use
carbon, about twice the carbon dioxide in
the atmosphere and nearly three times as
large as the carbon stocks of vegetation. His-
torically, soils in managed ecosystems have
lost a significant portion of this carbon (
40-
90
Pg) through land-use change - from
which some carbon has remained in the at-
mosphere. On the other hand, the capacity
for increases in soil organic carbon during
Stage III has the potential to sequester sig-
nificant amounts of carbon to help mitigate
the post-industrial rise in atmospheric CO
2
.
These competing possibilities present pol-
icy makers and scientists alike with import-
ant challenges and trade-offs, which will be
discussed below.
Land degradation, and specifically a decline
in soil organic carbon, is a typical - if not
universal - accompaniment of, or at least
the initial stages of, human land occupa-
tion. The curve seems a reasonable approxi-
mation of reality at all locations supporting
human agriculture and grazing; however, in
many locations, the degradation has been
stepwise, interspersed with partial recov-
ery. Given the scale of human modification
of the planet, it is probable that in aggregate
these local and regional impacts can have
global consequences. Over the past three cen-
turies,
30-
50% of global land surface and
more than half of the extent of fresh water
has been used by humans (Crutzen, 2002;
Zalasiewicz
et al
., 2010). Croplands and
pastures now rival forest cover as the major
biome on Earth (Foley
et al
., 2005).
Given the extent of our manipulation, it
is reasonable to conclude that the total sum
of local and regional changes on the planet-
ary landscape will add up to global effects.
For example, the sum of soil organic carbon
declines associated with Stage I of the curve
of
Fig. 3.2
is thought to have contributed to
the overall increase of CO
2
in the atmos-
phere (Smith
et al
., 2013). Specifically, soils
contain vast reserves (~1500 Pg) of organic
Turning Trade-offs into Synergies
at Local and Global Scales
Connecting the stages of the soil
carbon transition curve
The previous section concluded that the
soil carbon transition curve provided a con-
ceptual framework for the dynamics of the
decline and recovery of soil carbon in many
agricultural land-use trajectories around the
world. Agricultural productivity is achieved
Search WWH ::

Custom Search