Agriculture Reference
In-Depth Information
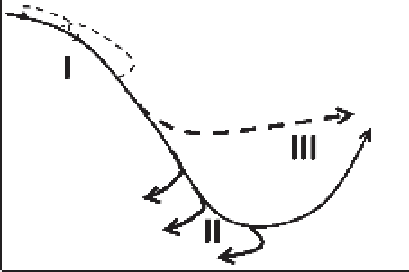
'the rise'
(Fig. 3.2)
. The latter is a stage of
rebuilding soil carbon stocks while main-
taining or increasing agricultural produc-
tion. The general pattern of 'degradation -
crisis - recovery' in the soil carbon transition
curve is similar to what has been referred to
as the 'forest transition curve' (Meyfroidt
and Lambin, 2011) or 'tree-cover transition
curve' (van Noordwijk
et al
., 2011).
with 1.63, 0.50, 5.27 and 1.47% of land area,
respectively (Batjes, 2011).
The relative share of these soil groups
differs between climatic zones, with high-
activity clays dominating in the temperate
zone and dry tropics and low-activity clays
(oxisols and ultisols) dominating the moist
and wet tropics, where leaching and weather-
ing rates are high (
Table 3.2
and Plate 3). The
mean soil carbon content in the top 30 cm of
the profile under natural vegetation ranges
from
9
to
143
Mg ha
-
1
,
with tropical dry zones
having the lowest soil carbon content and
cooler regions the highest (Batjes, 2011). In
terms of carbon emissions in response to agri-
cultural land use, the tropical peatlands stand
out (Chapter
19,
this volume). The approach
for reducing anthropogenic soil carbon emis-
sions may thus differ among soil types and
climatic zones when the focus is on food
production and the local benefits of main-
taining or restoring soil organic matter. We
will explore the diverse experience with the
three stages of the soil carbon transition curve
in major parts of the world before returning
to the issue of generic pattern versus site-
specific responses.
Diversity of soils and land use
Figure 3.2
represents a conceptual framework
to guide thinking and help develop site-specific
conceptual models to assess risks and explore
solutions. Any claim of a generic, repeatable
pattern such as depicted in
Fig. 3.2
is chal-
lenged by the vast diversity of soil types and
forms of land use. The guidelines of the Inter-
governmental Panel for Climate Change (IPCC)
for national greenhouse gas inventories pro-
vide a grouping of soils with respect to their
soil organic matter content and dynamics
that may represent the base minimum level
of classification. It distinguishes three main
texture classes (high-activity clays, low-
activity clays, sandy soils) of the main upland
soil types covering, respectively, 58.4, 14.08
and 10.05% of total land area, and four classes
that have considerably higher carbon content
but represent a much smaller area: spodosols,
recent volcanic soils, wetlands and peatlands,
The Soil Carbon Transition Curve
in Various Parts of the World
The curve shown in
Fig. 3.2
is typical for
managed soils across all climate zones and
arable soil types. In general, land-use alter-
ations lead to organic carbon loss and a de-
cline in soil fertility over periods ranging
from a few years to decades or centuries
(Stage I). Depending on the local conditions
and intensity of land use, this initial decline
is followed by a Stage II, which consists of
either a collapse or - at best - a stable situ-
ation at low soil productivity. The initiation
of agricultural practices to increase soil fertil-
ity often marks the beginning of a third stage
(Stage III), which involves modifications of
the original soil to bring more nutrients to the
crops and improve other aspects of soil fertil-
ity. In the following sections, we give a few
examples illustrative of the stages of impacts
on both agricultural and rangelands from
around the world.
Shifting
cultivation
Avoided degradation
trajectory
Soil restoration
Collapse
Local benefits from agricultural production
Fig. 3.2.
Schematic history of the decline of soil
organic matter and loss of its associated ecosystem
services as a result of agricultural production that
relies on the mineralization of soil organic nutrient
capital before alternate and more sustainable
management practices arise.
Search WWH ::

Custom Search