Agriculture Reference
In-Depth Information
Topsoil only or land-use effects
on deeper soil layers
for these positions. An example is the rub-
ber agroforest that tends to occur close to
rivers in soils with higher clay + silt content
than the locations where natural forest is
left in the landscape; higher C
org
data for
rubber agroforest relative to natural forest
turn into lower C
org
/C
ref
ratios once corrected
for texture.
A change in the intensity and depth of
soil tillage affects C
org
distribution in the
soil, rather than the total C stock, and initial
claims that reduced tillage is a C storage op-
tion had to be reconsidered when data for
the whole soil profile were included in the
analysis. When assessed across nitrous oxide,
CO
2
and methane, there may still be positive
effects (Ruan and Robertson, 2013).
Most of the data refer to changes in the top-
soil, which generally are more readily ob-
servable and where changes may occur
more rapidly after land cover and land-use
change. For the total soil-atmosphere flux,
deeper soil layers may be at least as import-
ant (Nepstad
et al
., 2002), depending on the
presence of deep-rooted trees that stay green
in dry periods.
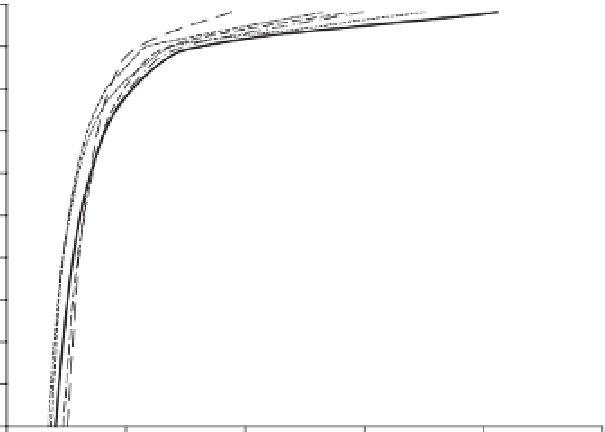
In a recent study in Sumatra, an area
where deforestation has almost run its course
over the past three decades, statistically
significant differences in soil C stock with
depth could only be ascertained for the top
10 cm, once the depth data were corrected
for the bulk density under the influence of
land use (
Fig. 31.3)
. The bulk density cor-
rection removed about half of the apparent
difference in soil C stocks if only C
org
data
were available. Correction for differences in
soil texture using the C
ref
equation of van
Noordwijk
et al
. (1997) and Hairiah
et al
.
(2011) helps in separating true land-use ef-
fects from the covariance of land use, positions
in the landscape and the soil texture typical
Default estimates for land-use effects
on soil C stocks
As part of the second IPCC review, Paustian
et al
. (1997) summarized known effects of
land-use change on soil carbon across cli-
matic zones and soil types. Subsequent
literature has lead to some refinement. Don
et al
. (2011) in a global meta-analysis of
385
0
-
5
-
10
-
15
Natural forest
-
20
Logged-over forest
-
25
-
30
Rubber agroforest
-
35
Perennial crops
-
40
Secondary forest
-
45
Shrub
-
50
0
0.5
1
BD
ref
*C
org
/C
ref
1.5
2
2.5
Fig. 31.3.
Relationship between C
org
/C
ref
and the mean depth of sampled soil layers in a deforestation
landscape in Sumatra (Indonesia); the regression lines shown represent
54-
85% of variation, except the
secondary forest line, which represents only 31% of variation at sample level.


Search WWH ::

Custom Search