Agriculture Reference
In-Depth Information
(a)
2.5
2.0
1.5
1.0
0.5
0.0
-0.5
(b)
0.4
0.3
0.2
0.1
0.0
-0.1
-
5
0
5
10
15
20
25
Relative change in crop yield (%)
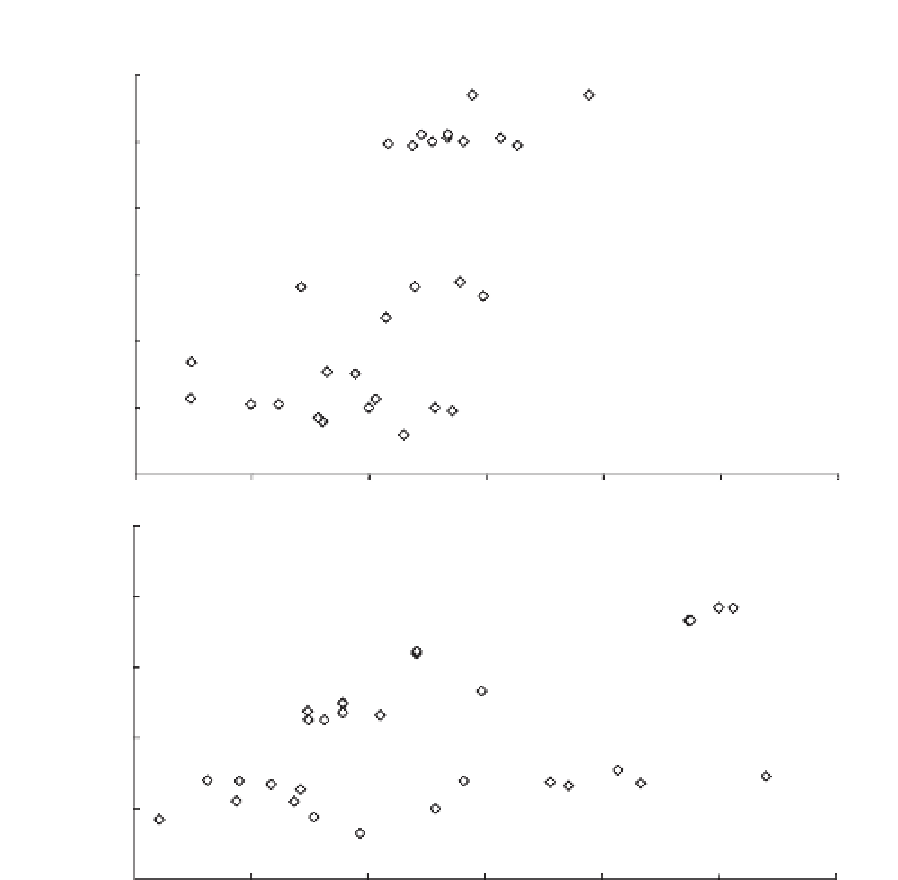
Fig. 27.1.
A coupling of soil organic carbon content change with crop yield change under conservation
tillage experiments of China (a, rice paddies; b, dry croplands) (Wang
et al
., 2009).
Table 27.2.
Crop yield variability over years, from different experiment sites with various SOM levels.
(Courtesy of Dr Xu Mingang for the yield and SOC data from the long-term experiments sites between
the late 1980s and early 2000s.)
Yield variability (%) under
different treatments
Topsoil SOM
(g C kg
-1
)
Min
Max
Agro/ecoregion
Cropping system
Tai Lake Plain
Rice
8
30
18.0
Northern Zhejiang Plain
Rice
12
30
16.0
Purple basin of Sichuan
Summer rice
13
20
16.0
Rolling area of red soils, Jiangxi
Double rice
8
17
16.5
Central China Plain
Wheat-maize
30
45
7. 5
Rolling area of red soils, Hunan
Winter wheat
30
40
10.0
Purple basin of Sichuan
Winter wheat
15
30
16.0


Search WWH ::

Custom Search