Graphics Programs Reference
In-Depth Information
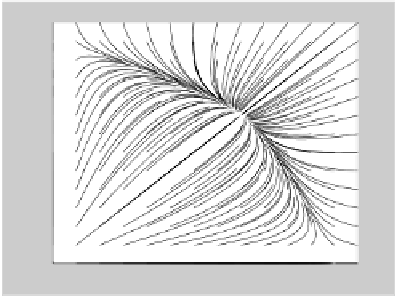
Thegraphicalevidencesuggeststhat:Thesolutionthatstartsatzerostays
there; all the others tend toward the constant solution 1.
(c)
clear all; close all; hold on
f = inline('[x(1) - x(1)ˆ2 - 0.5*x(1)*x(2); x(2) - x(2)ˆ2 -
0.5*x(1)*x(2)]', 't', 'x');
for a = 0:1/12:13/12
for b = 0:1/12:13/12
[t, xa] = ode45(f, [0 3], [a,b]);
plot(xa(:, 1), xa(:, 2))
echo off
end
end
axis([0 13/12 0 13/12])
1
0.9
0.8
0.7
0.6
0.5
0.4
0.3
0.2
0.1
0
0
0.1
0.2
0.3
0.4
0.5
0.6
0.7
0.8
0.9
1
(d)
The endpoints on the curves are the start points. So clearly any curve
that starts out inside the first quadrant, that is, one that corresponds to
a situation in whichbothpopulations are present at the outset, tends
toward a unique point — which from the graph appears to be about
(2/3,2/3). In fact if
x
=
y
=
2
/
3, then the right sides of both equations in
(4) vanish, so the derivatives are zero and the values of
x
(
t
) and
y
(
t
)
remain constant — they don't depend on
t
. If only one species is present
at the outset, that is, you start out on one of the axes, then the solution


Search WWH ::

Custom Search