Graphics Programs Reference
In-Depth Information
5
4
3
2
1
0
−
1
−
2
−
3
−
4
−
5
−
5
−
4
−
3
−
2
−
1
0
1
2
3
4
5
(c)
We note that
f
(1
,
1)
=
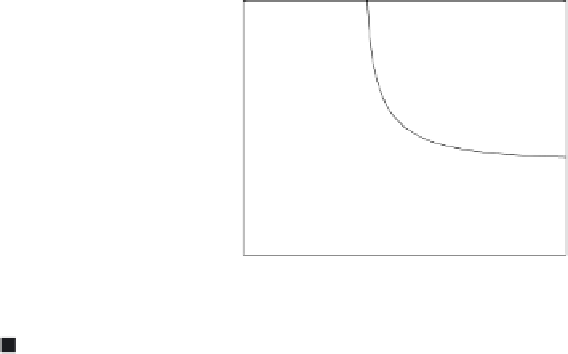
0, so the appropriate command to plot the
level curve of
f
through the point (1, 1) is
[X, Y] = meshgrid(0:0.1:2, 0:0.1:2); contour(X, Y, Y.*log(X)
+ X.*log(Y), [0 0], 'k')
Warning: Log of zero.
Warning: Log of zero.
2
1.8
1.6
1.4
1.2
1
0.8
0.6
0.4
0.2
0
0
0.2
0.4
0.6
0.8
1
1.2
1.4
1.6
1.8
2
Problem 2
We find the derivatives of the given functions:
syms x r


Search WWH ::

Custom Search