Graphics Programs Reference
In-Depth Information
1
0.8
0.6
0.4
0.2
0
-0.2
-0.4
-0.6
-0.8
-1
0
0.5
1
1.5
2
2.5
3
3.5
Figure11-3
% Example: shadecurves('sin(x)', '-sin(x)', 0, pi)
ffun = inline(vectorize(f)); gfun = inline(vectorize(g));
xvals = a:(b - a)/50:b;
plot([xvals, xvals], [ffun(xvals), gfun(xvals)])
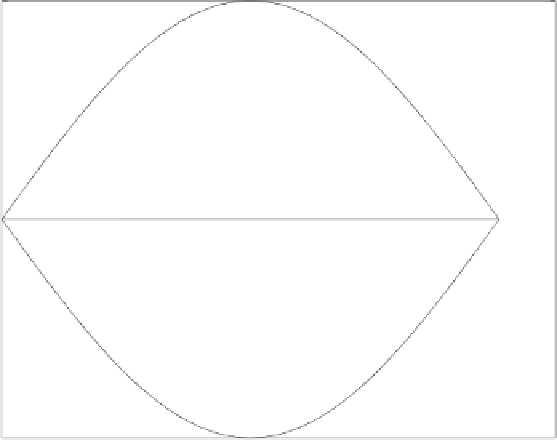
Trying this M-file out with the example specified in the help lines, that is,
executing
>> shadecurves('sin(x)', '-sin(x)', 0, pi)
or
>> syms x; shadecurves(sin(x), -sin(x), 0, pi)
gives the output shown in Figure 11-3.
Thisisnotreallywhatwewanted;thefigureweseekisshowninFigure 11-4.
To begin to determine what went wrong, let's try a different example, say
>> shadecurves('xˆ2', 'sqrt(x)', 0, 1)
>> axis square
or
>> syms x; shadecurves(xˆ2, sqrt(x), 0, 1)
>> axis square
Now we get the output shown in Figure 11-5.


Search WWH ::

Custom Search